Case Study / Amazon
Building Report Builder for Amazon Brand Sellers
Duration
3 Months
Role
Product Designer
Team
1 UX Manager, 1 Designer, 1 UX Researcher
Tools
Figma, UserTesting
Overview
A 0→1 report builder helping Selling Partners find, customize, and act on the data that drives their business decisions.
The Challenge
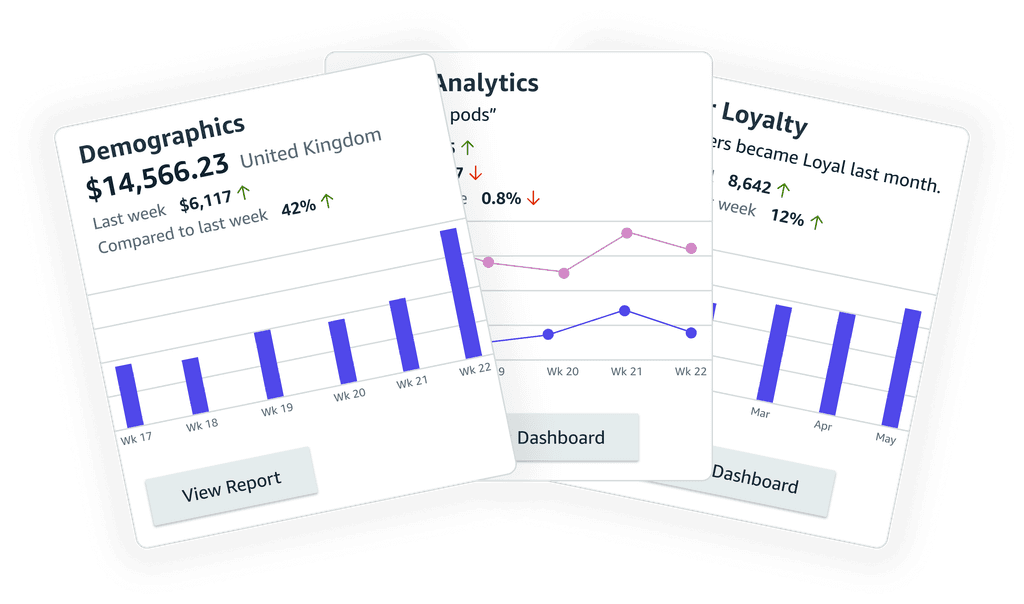
Gathering reports on Seller Central is a fragmented, non-intuitive experience.
Selling Partners rely on 6+ tools to pull 10+ reports, leading to inefficiency and data issues — and driving them to third-party tools like Helium10 and JungleScout, away from Amazon's ecosystem. On Seller Central, conversions thrive on data that makes sense: speed, accuracy, and insight directly influence subscriptions, business ROI, and daily active users.
Research
Sellers prioritize certain metrics — and edit their reports to get them.
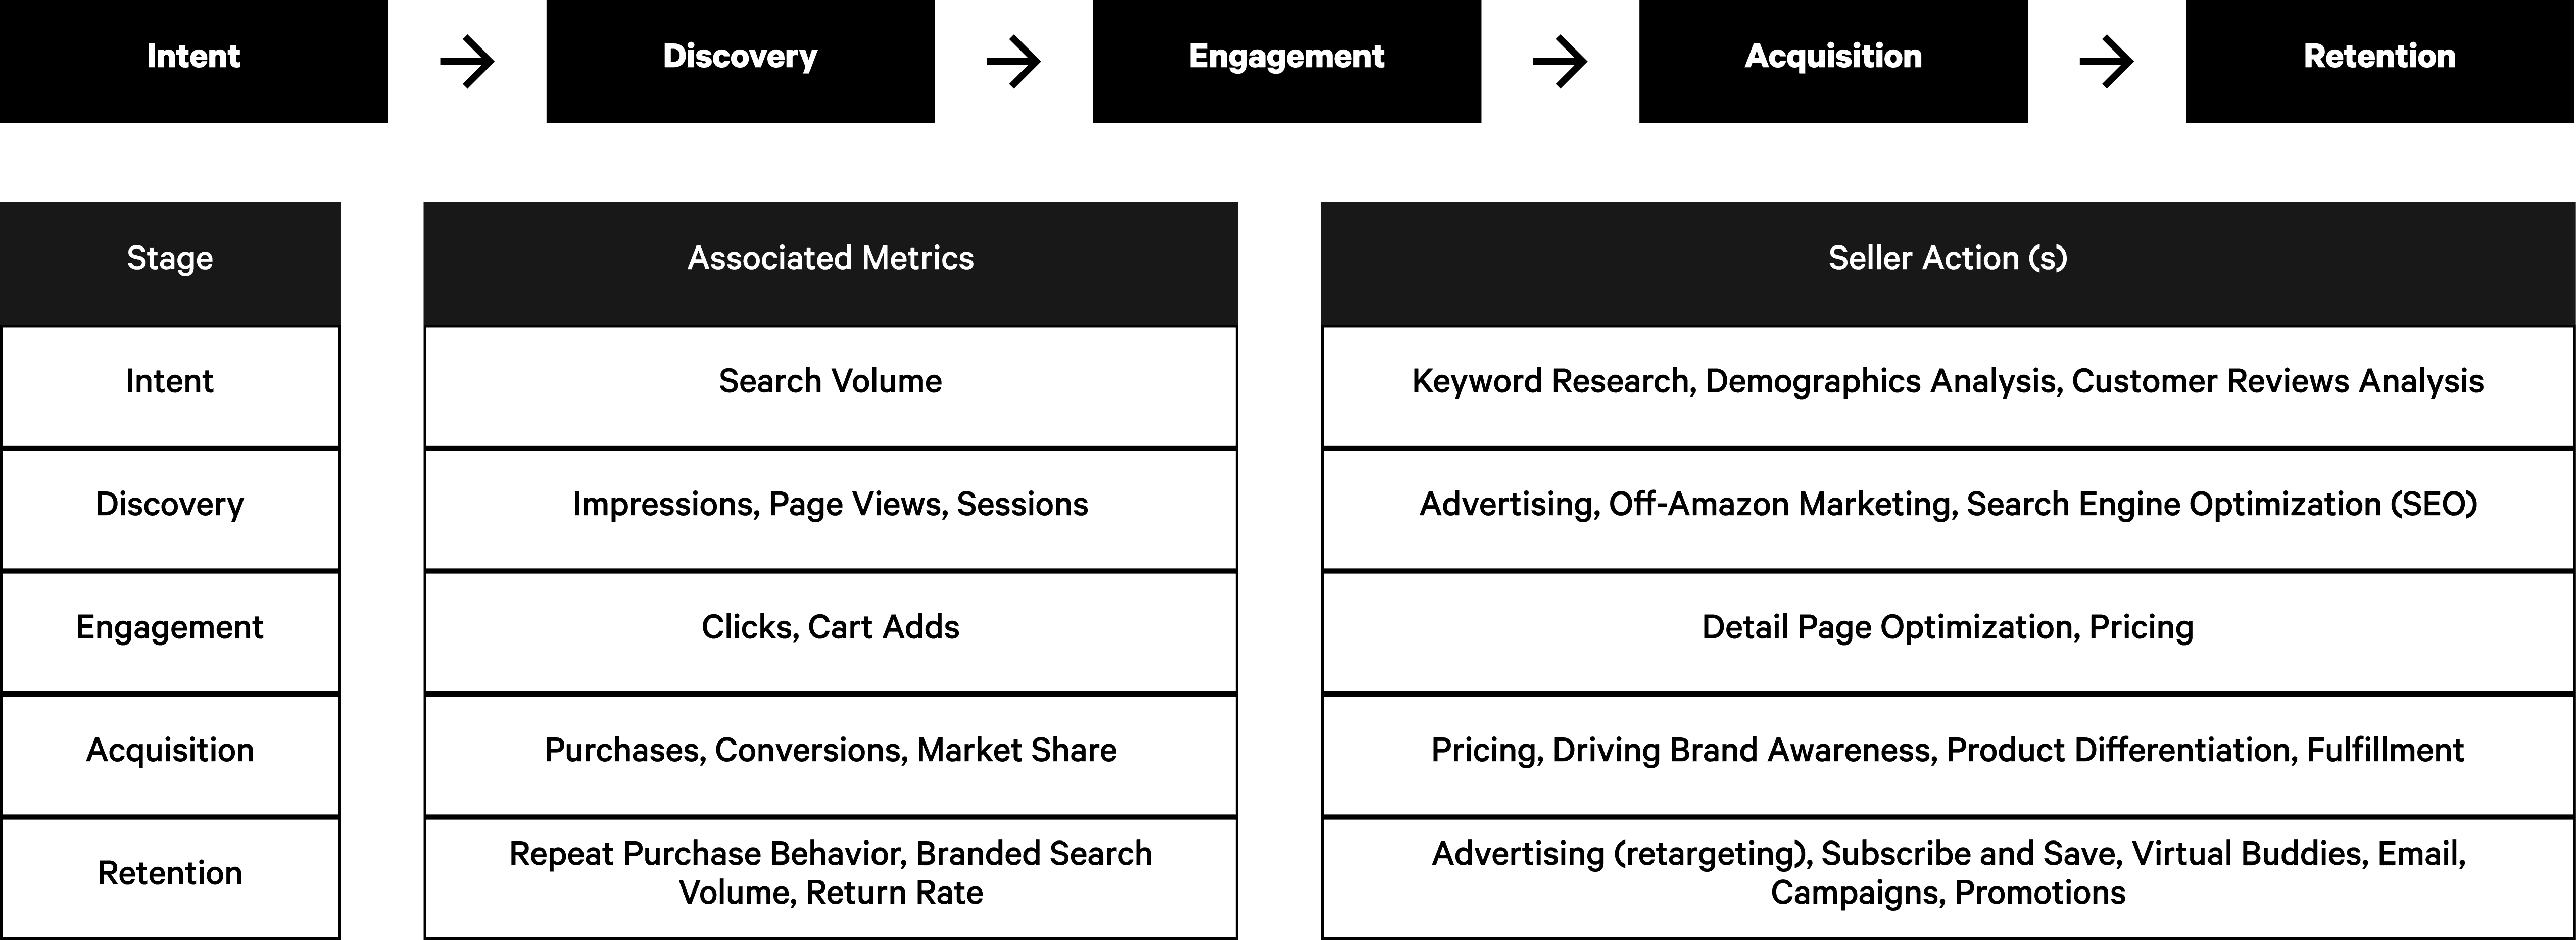
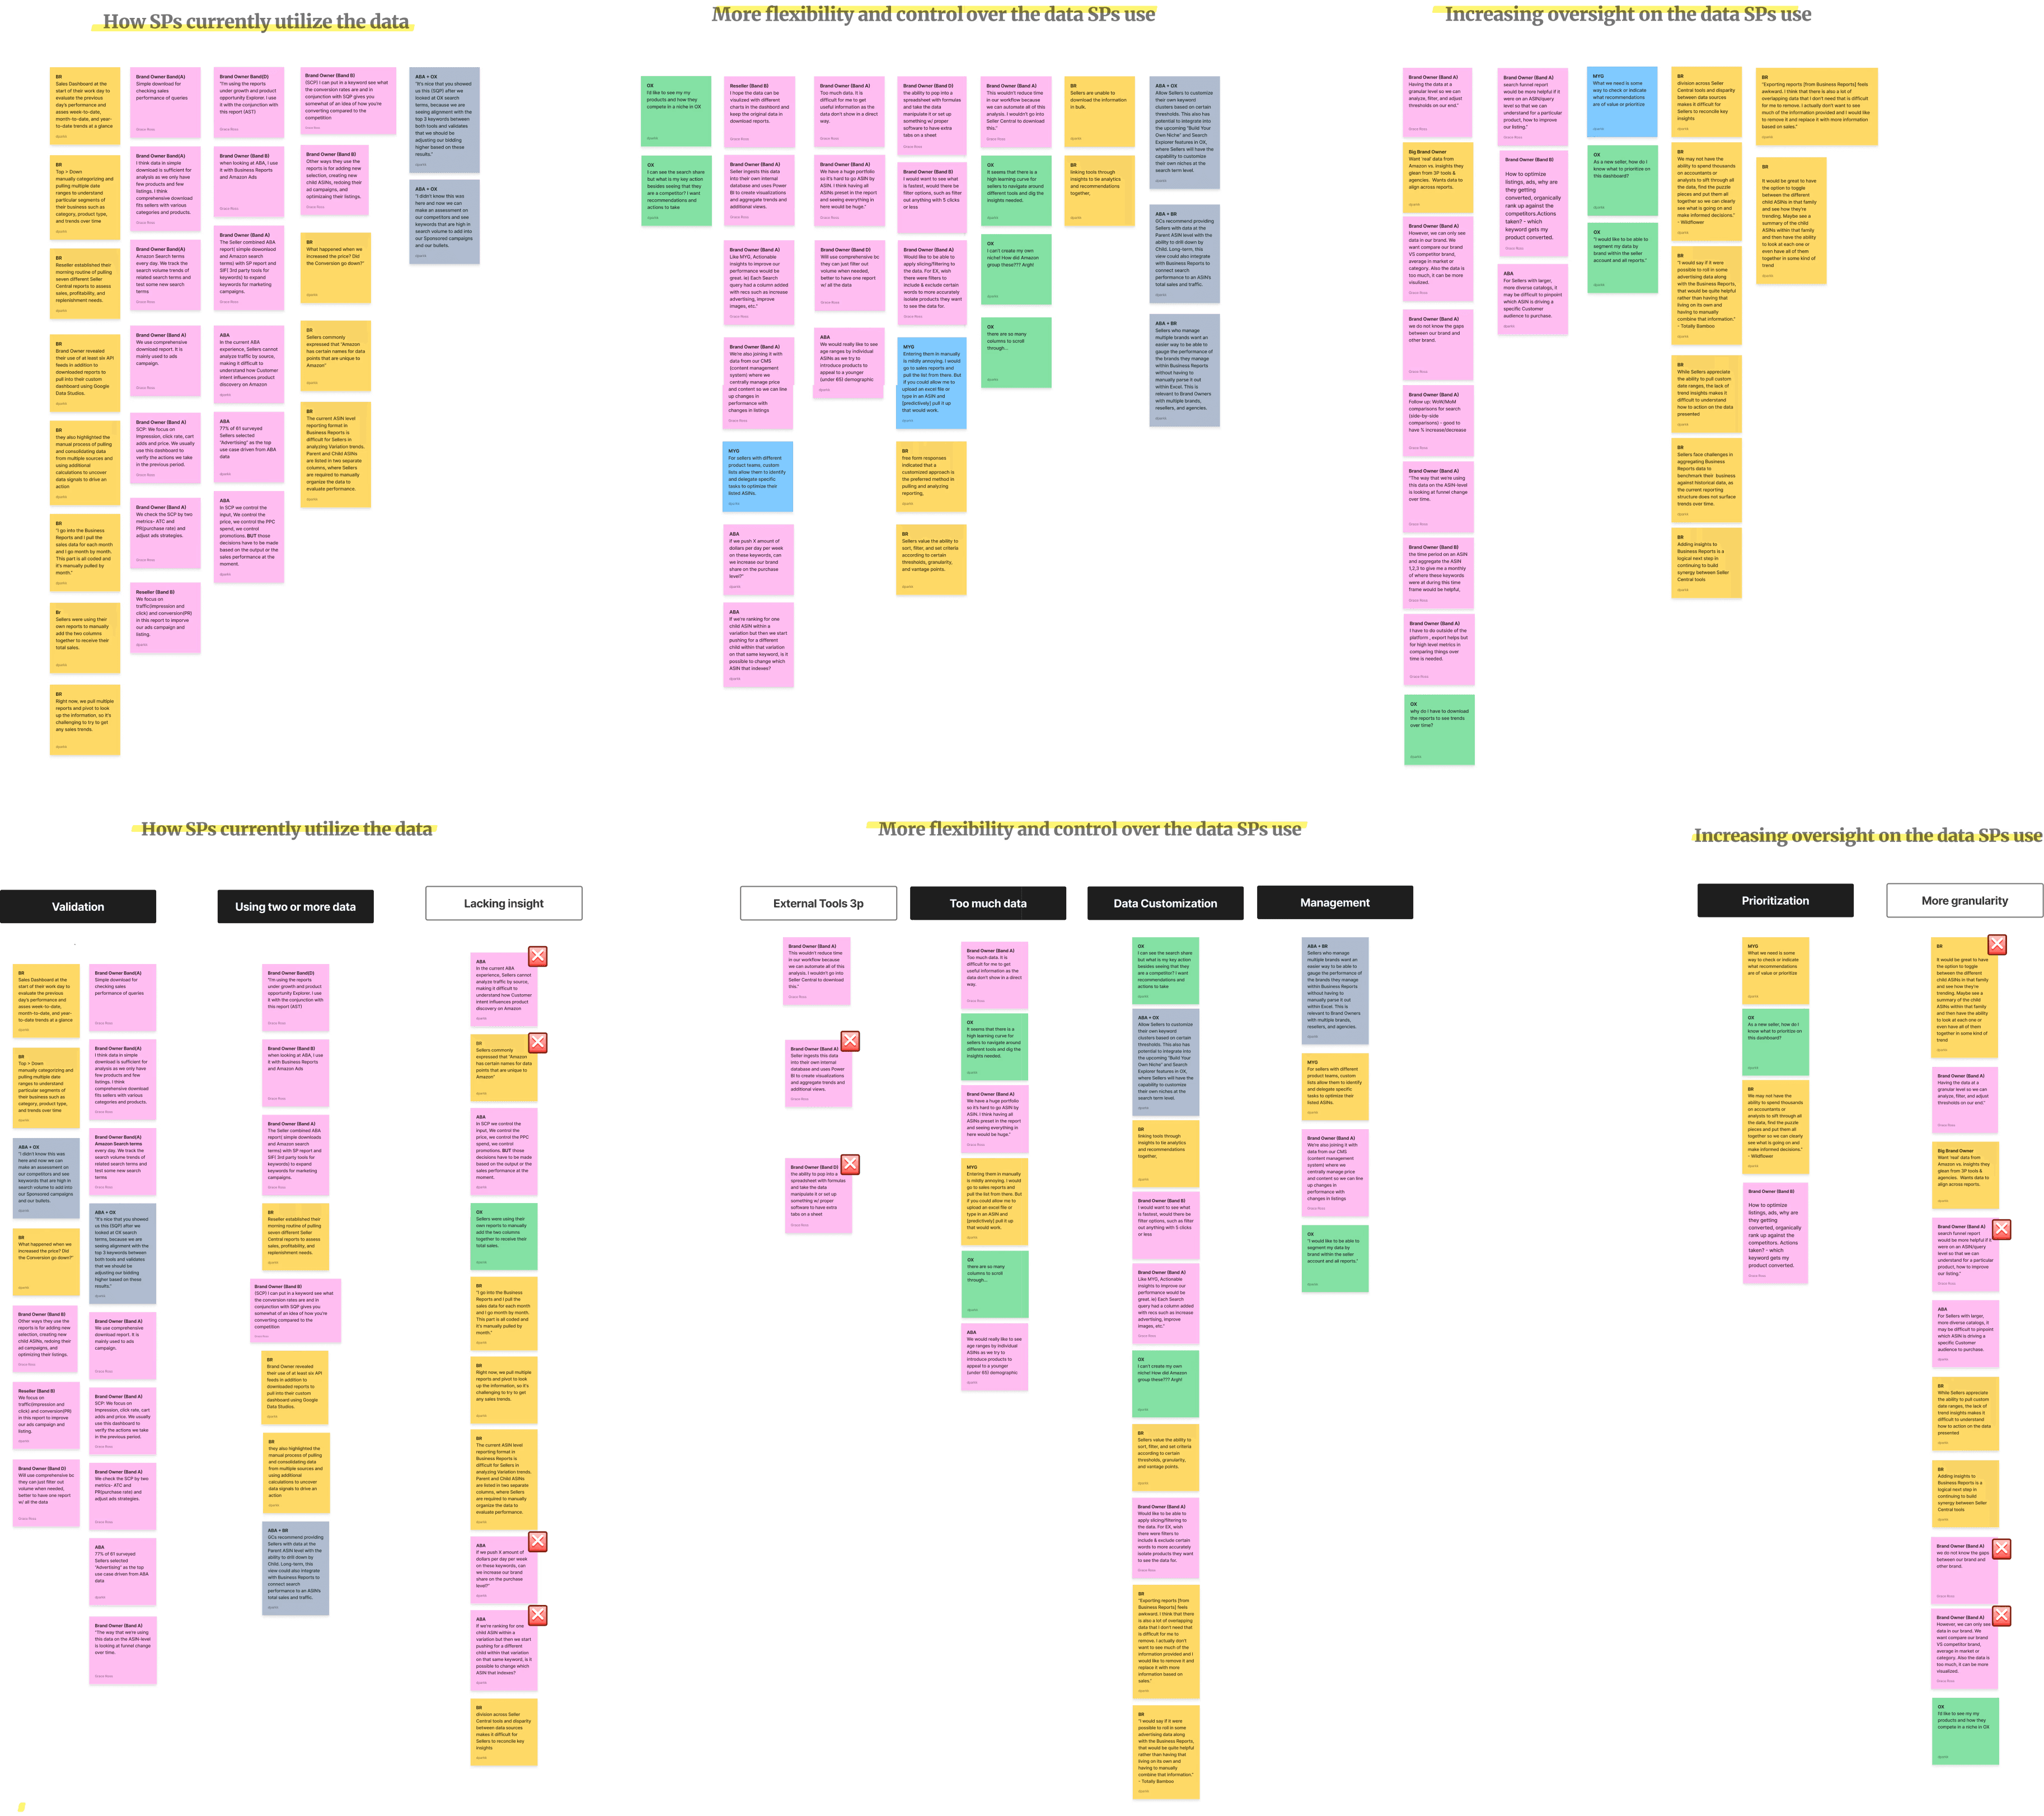
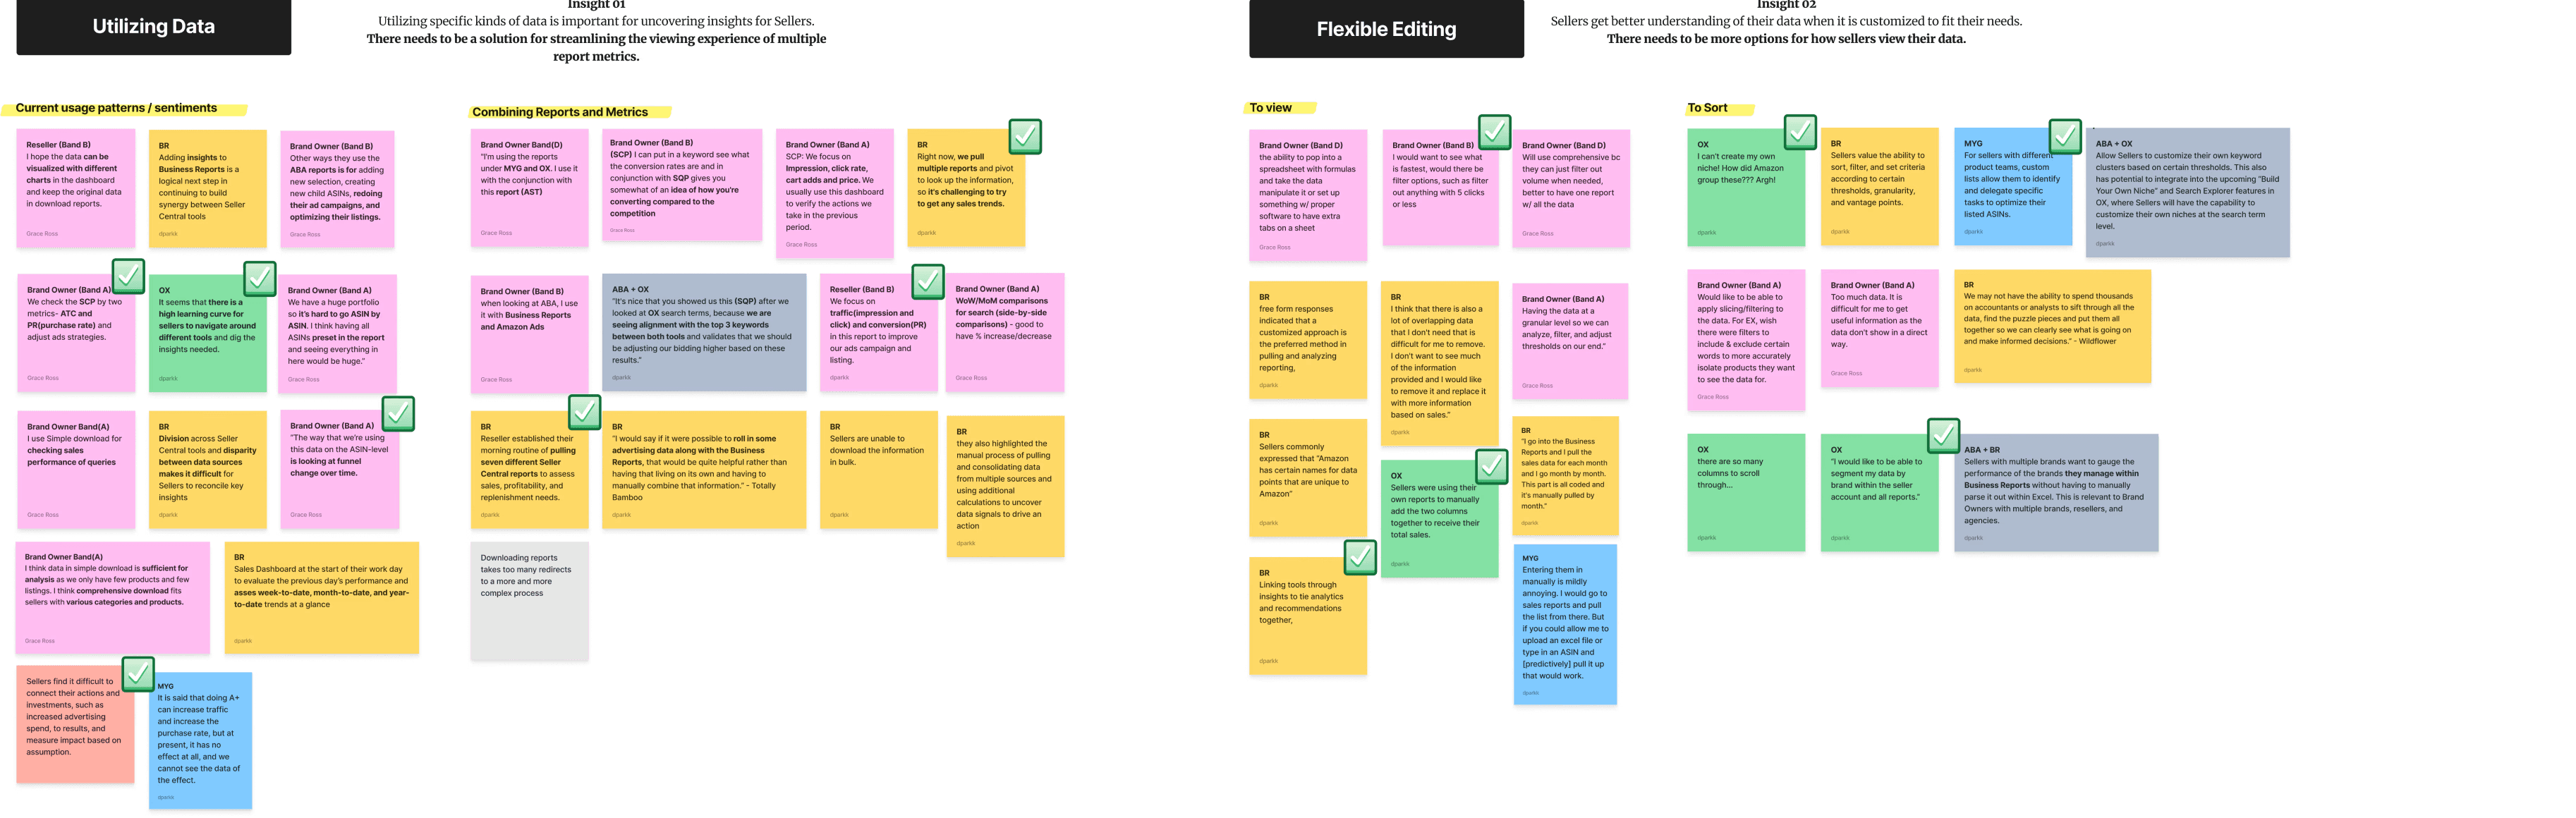
We identified that partners prioritize specific types of metrics when taking action on Seller Central. This explains why many partners edit reports after downloading — pulling out the exact metrics they need to optimize conversion. I synthesized past research through affinity mapping to understand our tools, user motivations, and future goals more granularly.
Affinity Mapping / Three Insights
01 / Accuracy
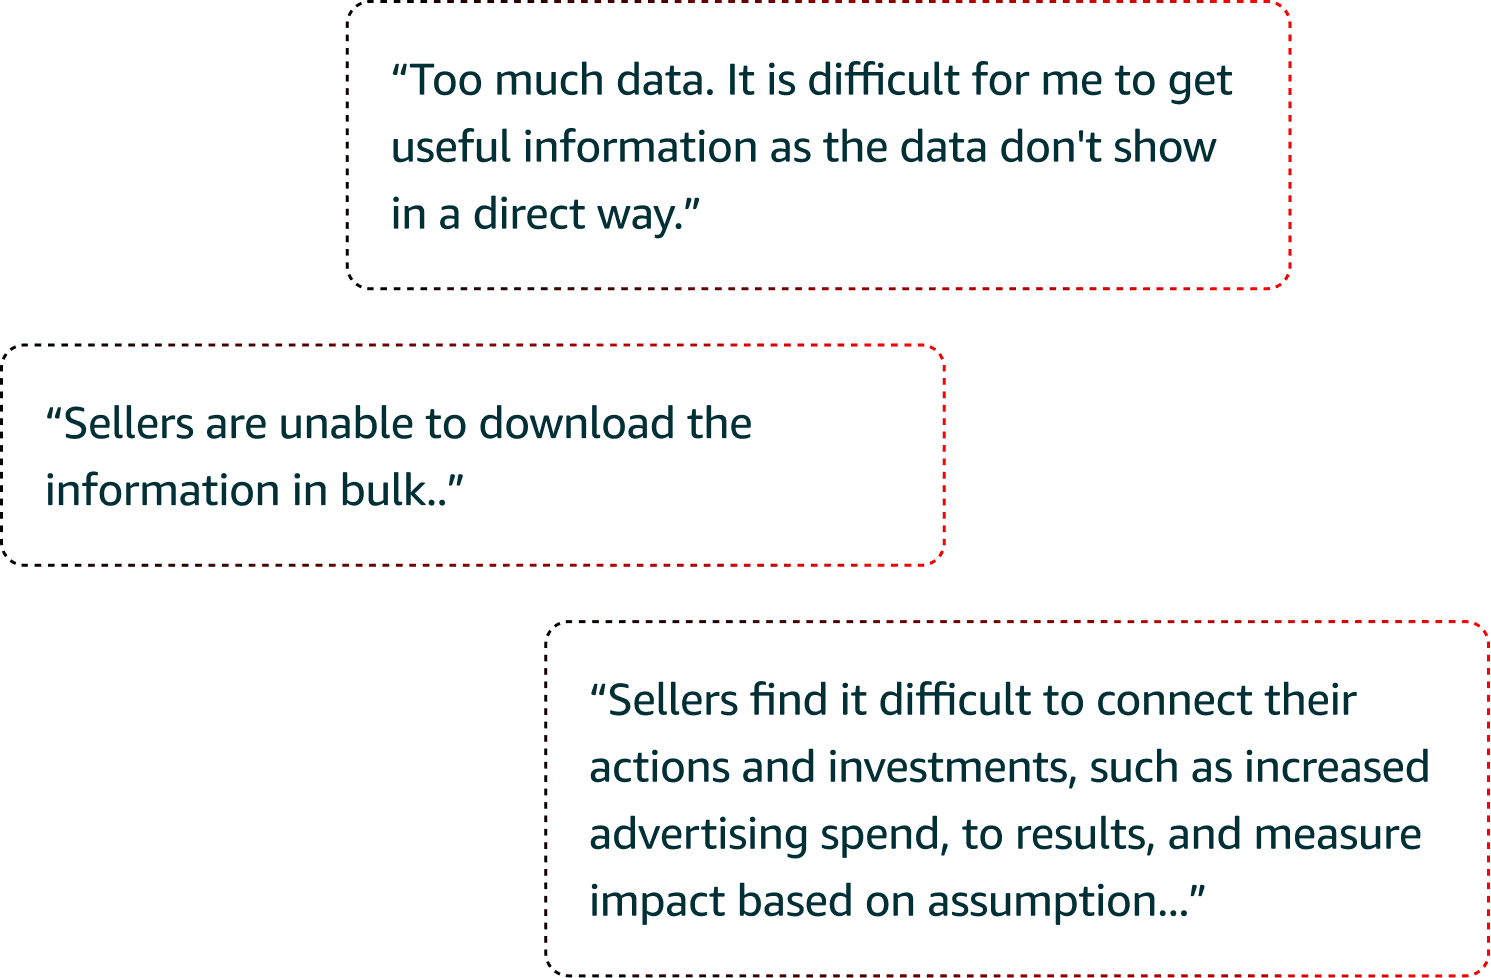
"Too much data. It is difficult for me to get useful information as the data don't show in a direct way."
Insight: There needs to be a clearer way of showcasing data that is useful for Selling Partners.
02 / Awareness
Sellers find it difficult to connect their actions and investments — such as increased ad spend — to results, measuring impact based on assumption.
Insight: There needs to be more guidance on how sellers reach insights from their data.
03 / Flexibility
"Sellers are unable to download the information in bulk."
Insight: There needs to be better options for how sellers consume their data.
Defining
Framing the problem, hypothesis, and seller story.
Problem Statement
"As a Seller, I compare metrics regarding sales, customer behavior, and competitor performance. Having access to timely and flexible data is important for how I take actions to grow my business. However, I encounter roadblocks with how I currently view and consume my data on Seller Central."
Hypothesis Statement
"With more flexibility and options to consume my data, I can explore better insights and make better data-driven decisions."
Seller Statement
"I need summary-level insights that maximize value and understanding of key data across reports, help me identify areas that need my attention, with data-informed recommendations at the Customer and Financial analytics level."
Competitive Analysis
Understanding the gaps competitors were filling.
Competitive analysis revealed that tools like Helium10 offered more flexible and granular data downloads than Seller Central. This highlighted the need to reduce friction and make data retrieval faster and more useful for sellers' daily tasks — keeping them within Amazon's ecosystem.

Guiding the Ideation
Research revealed varying seller familiarity with reports — some unsure where to start, others confident in their adjustments. To accommodate both, I crafted guiding questions to inform my designs.
01
How can I learn to repeat this process regularly?
02
How can I take control and make adjustments along the way?
03
How does this help my business needs specifically?
The Solution
Three concepts to bring every report into one experience.
All Reports, One View
Combines all reports on one page, reducing manual download time and effort.
Customization Options
Allows users to adjust thresholds and filter metrics per report, saving time on manual tasks.
Nudge
Recommends reports to help sellers access key insights more efficiently.
Iteration
From user flows to low-fidelity explorations.
Based on the solutions above, I sketched multiple user flows addressing customization, simplicity, and suggestions — then translated them into low-fidelity concepts to help business owners find, customize, and be recommended the reports they need.
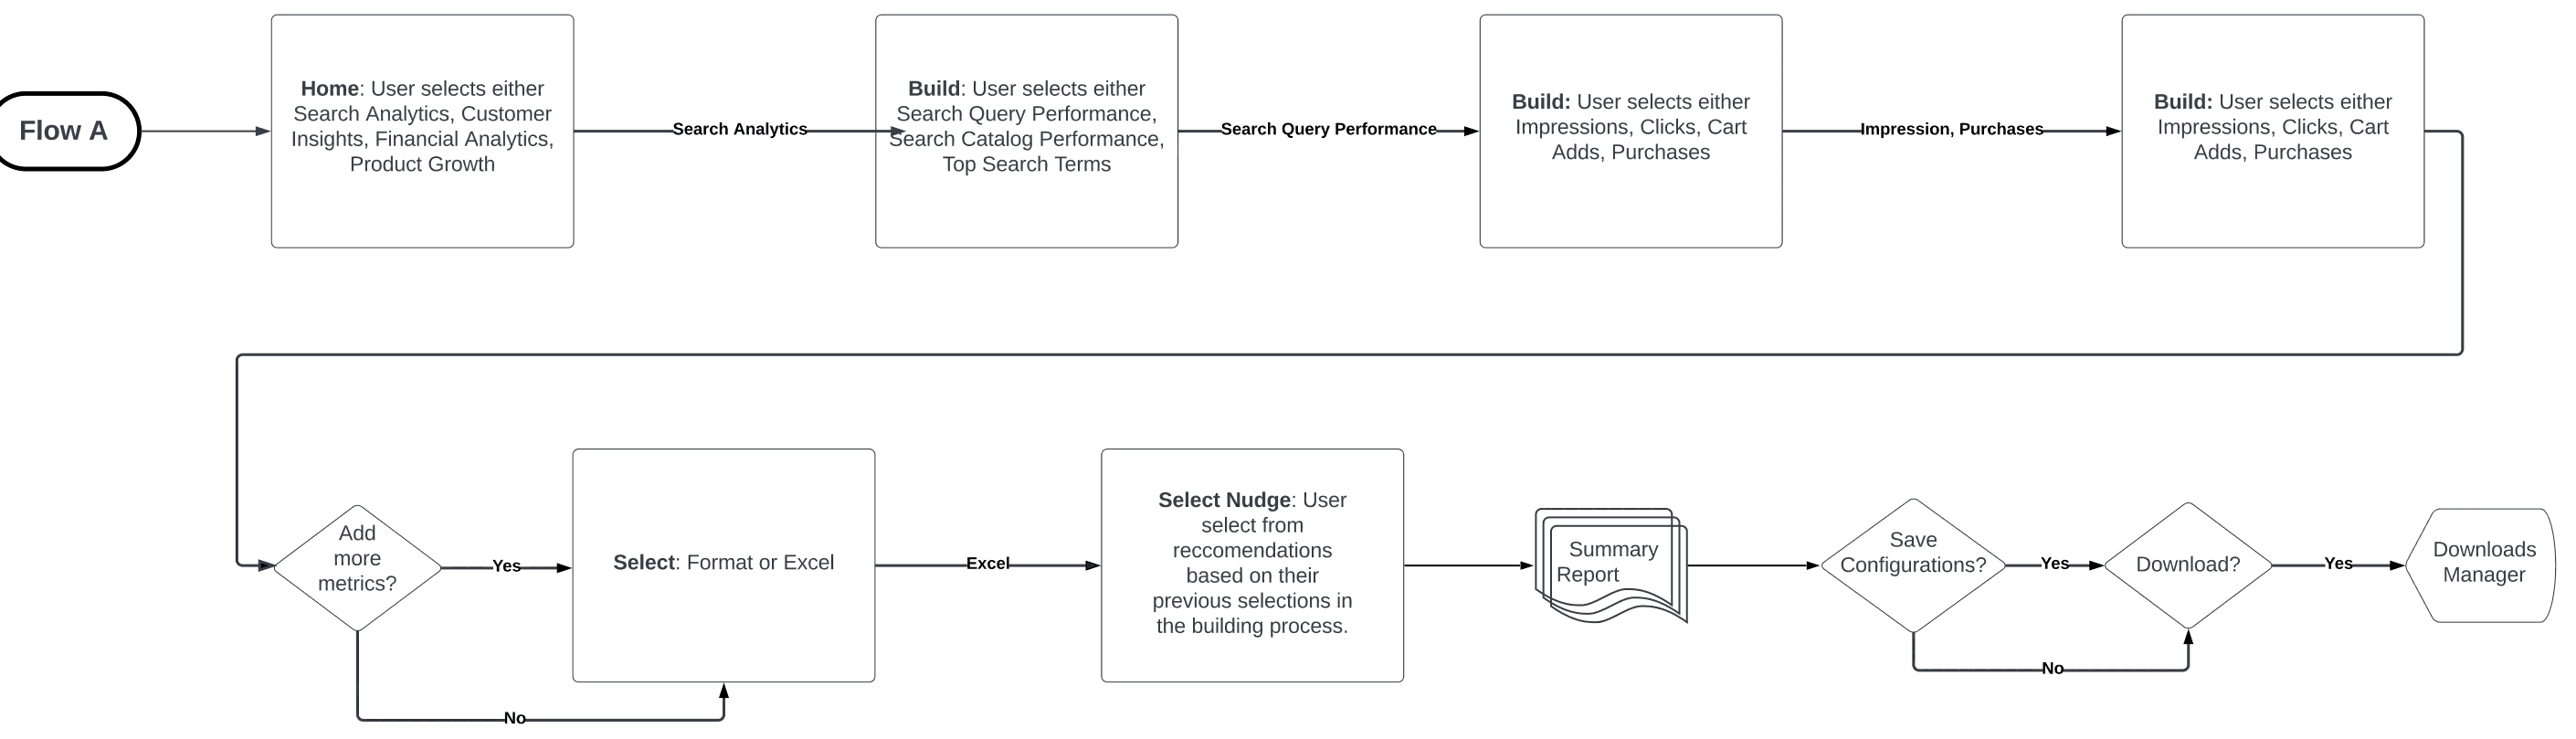
The Core Flow / Three Steps
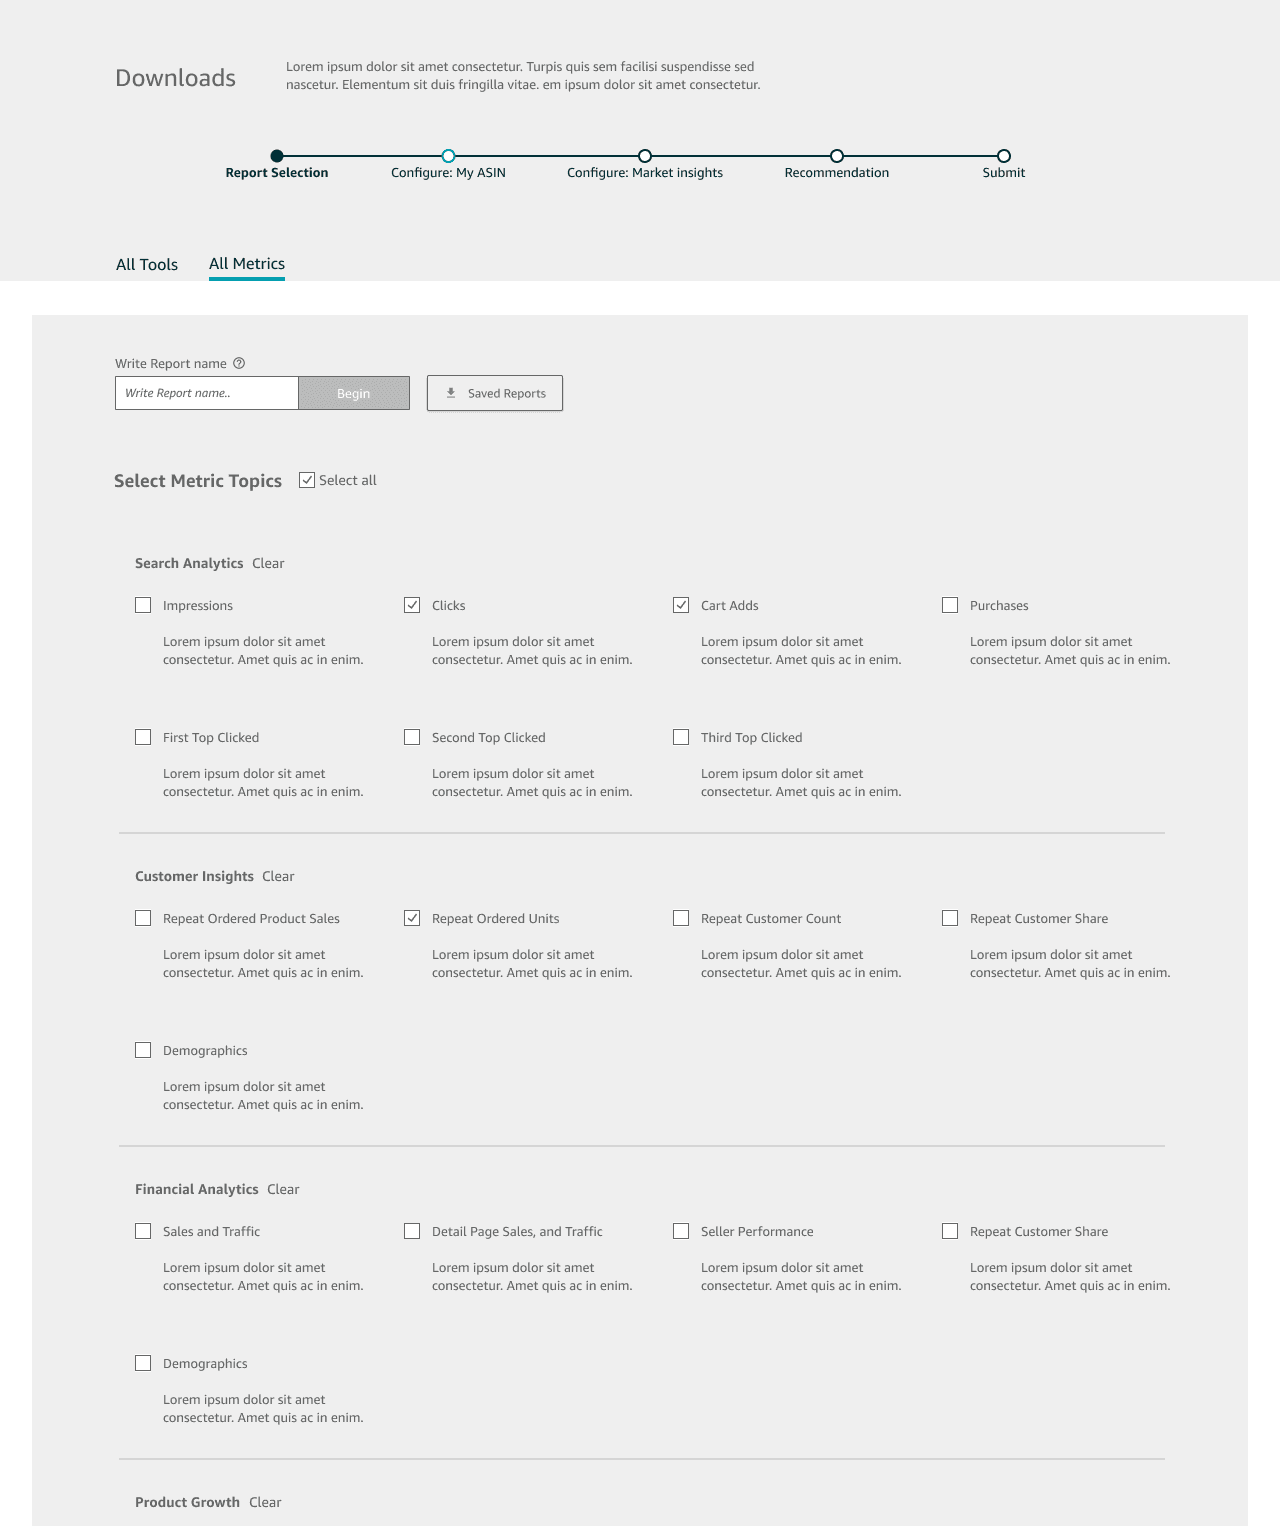
01
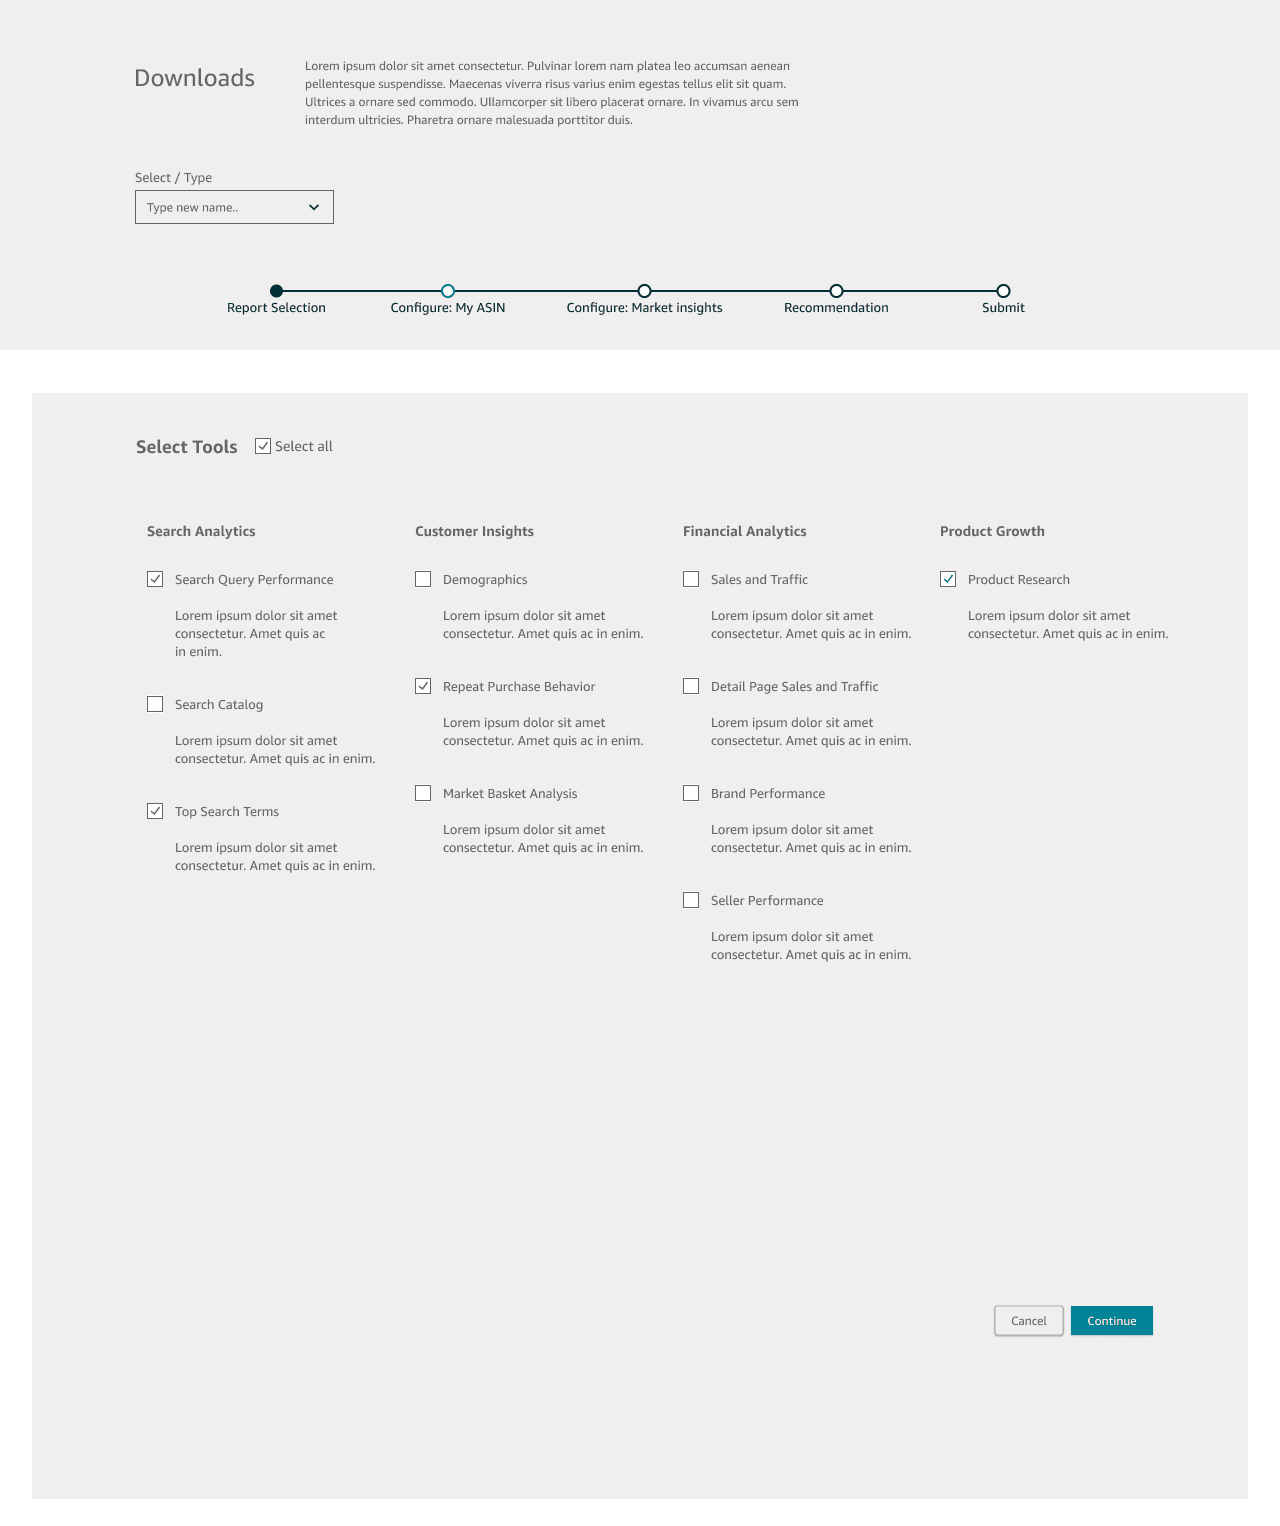
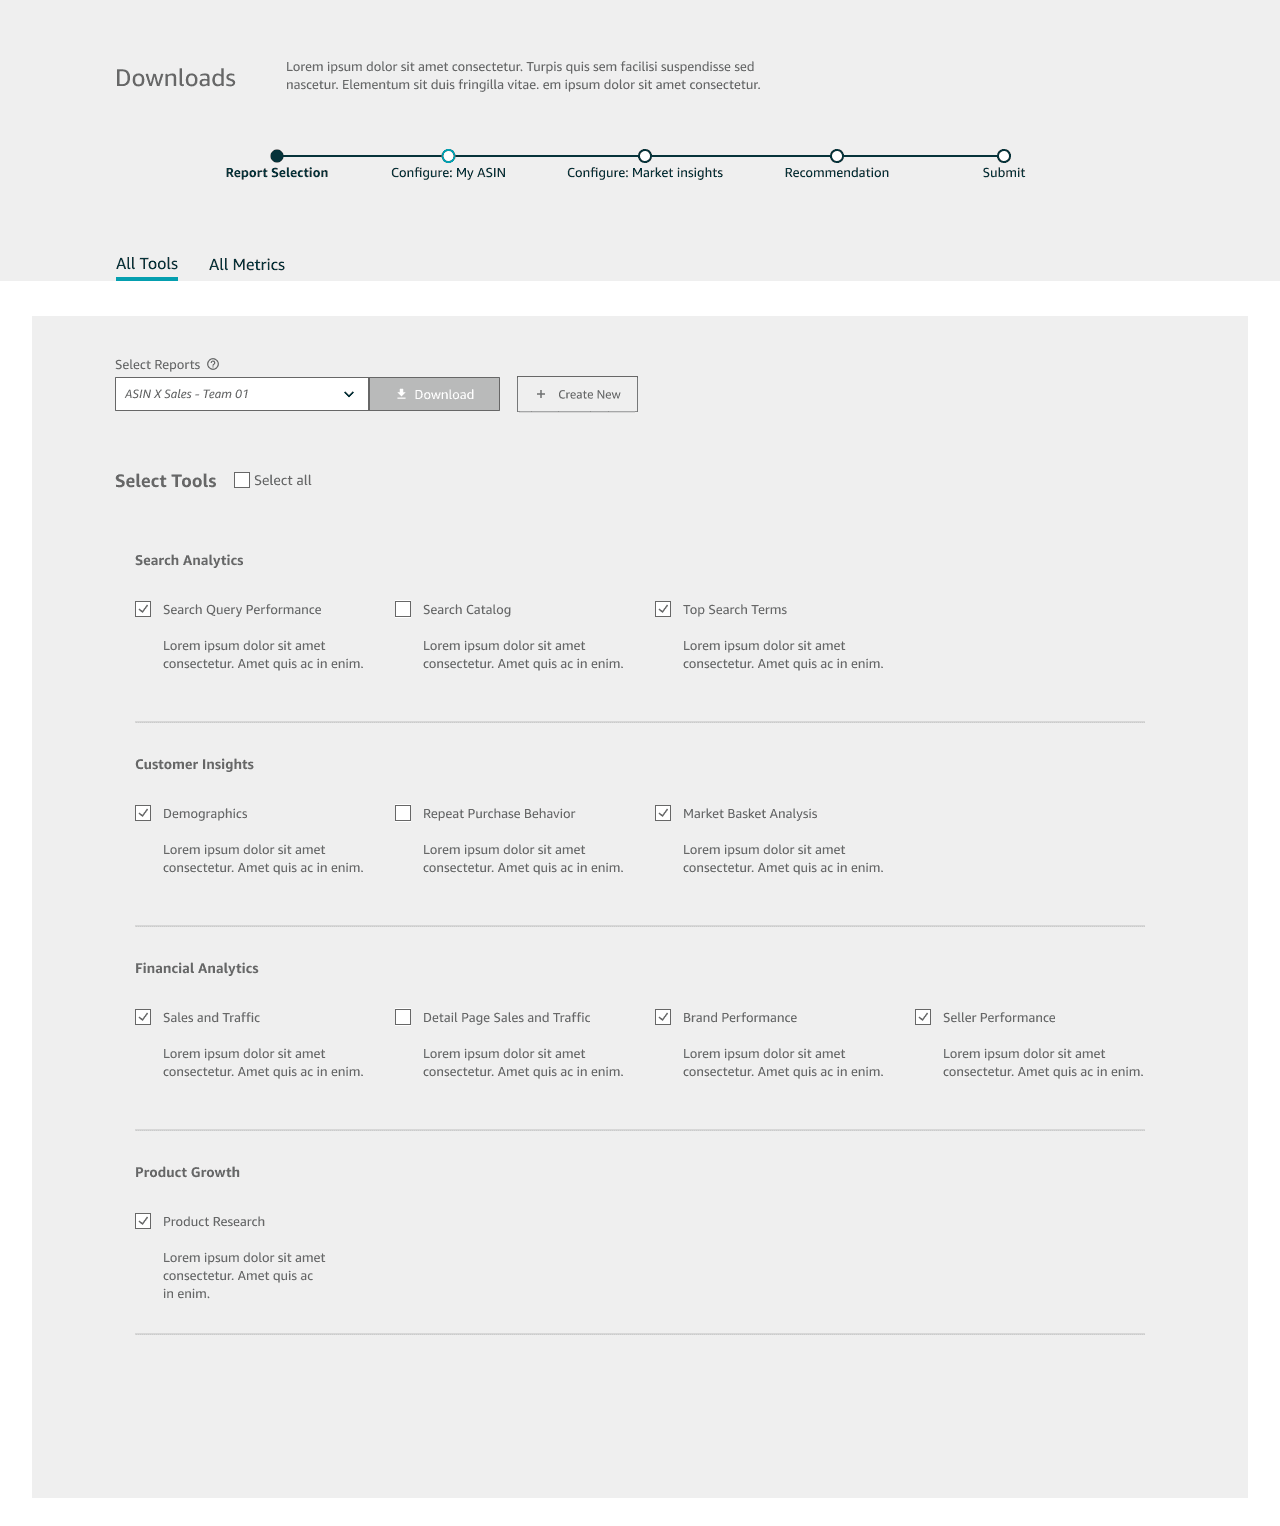
Selection Process
Clicking 'Report Builder' brings selling partners to a page where they can view and select reports across Seller Central analytic tools.
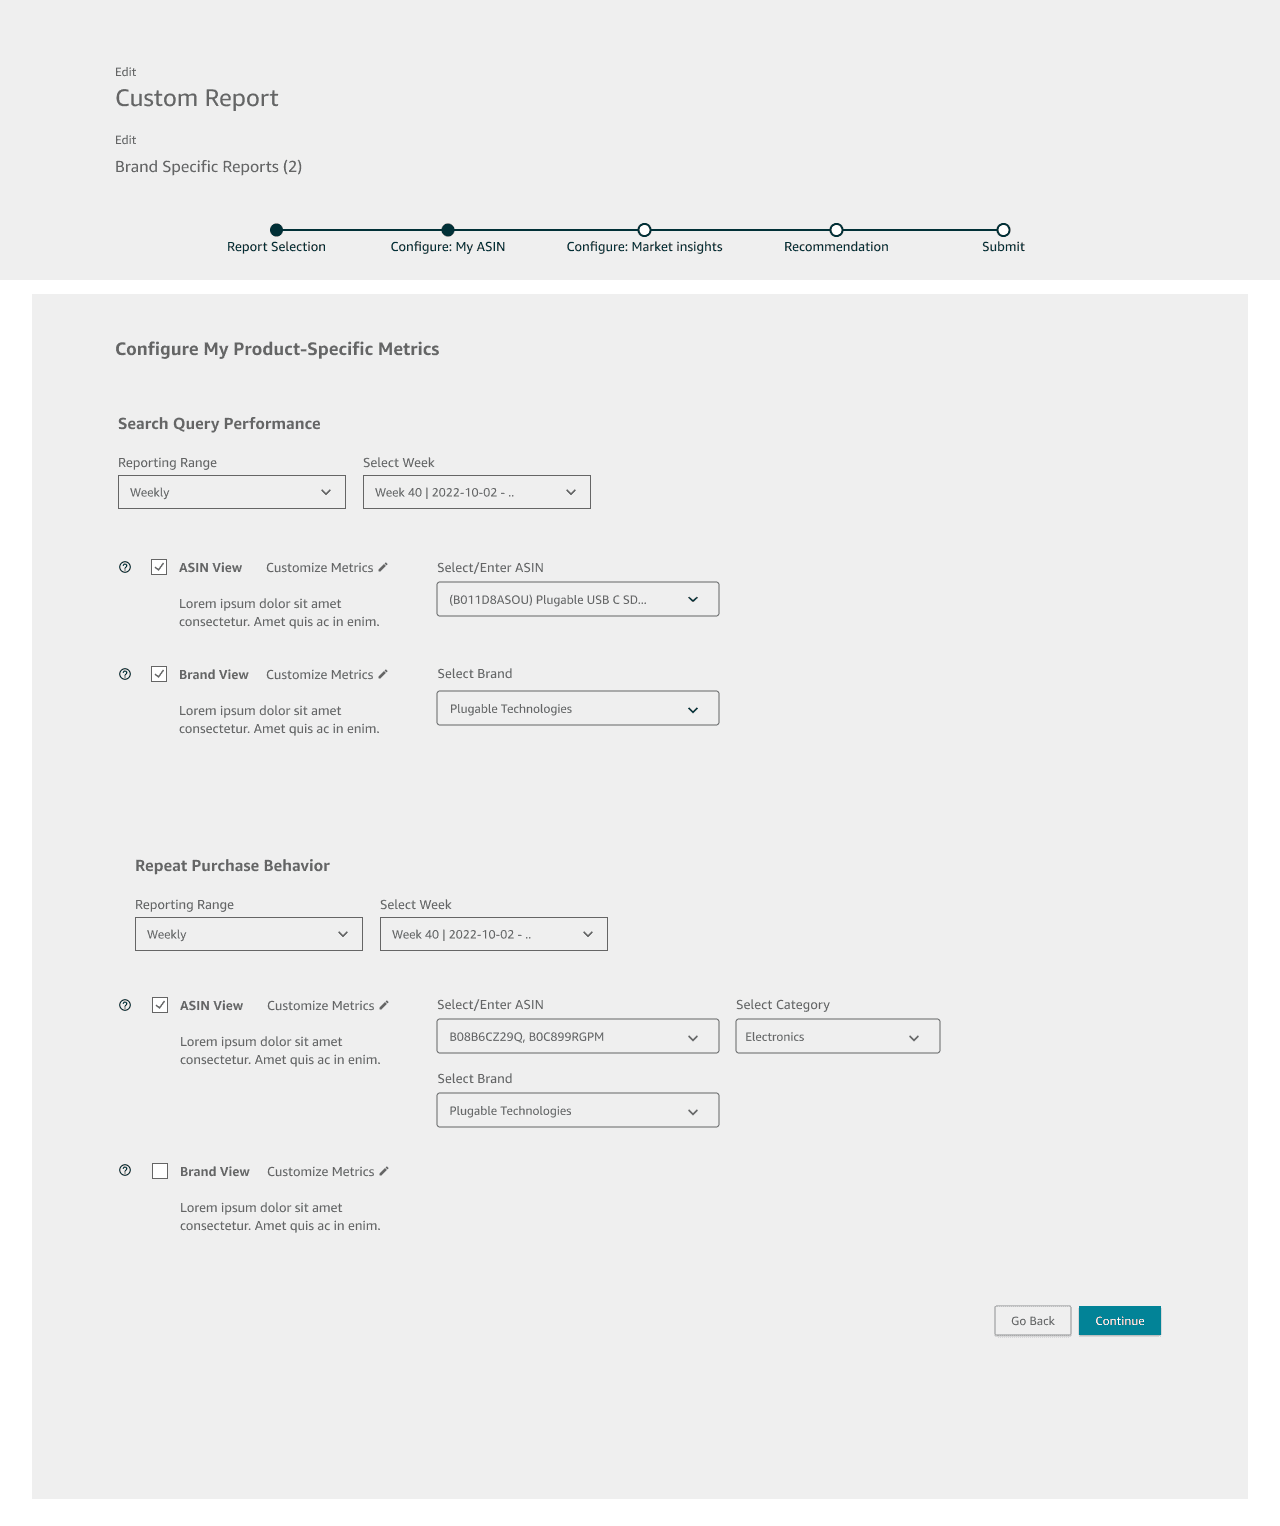
02
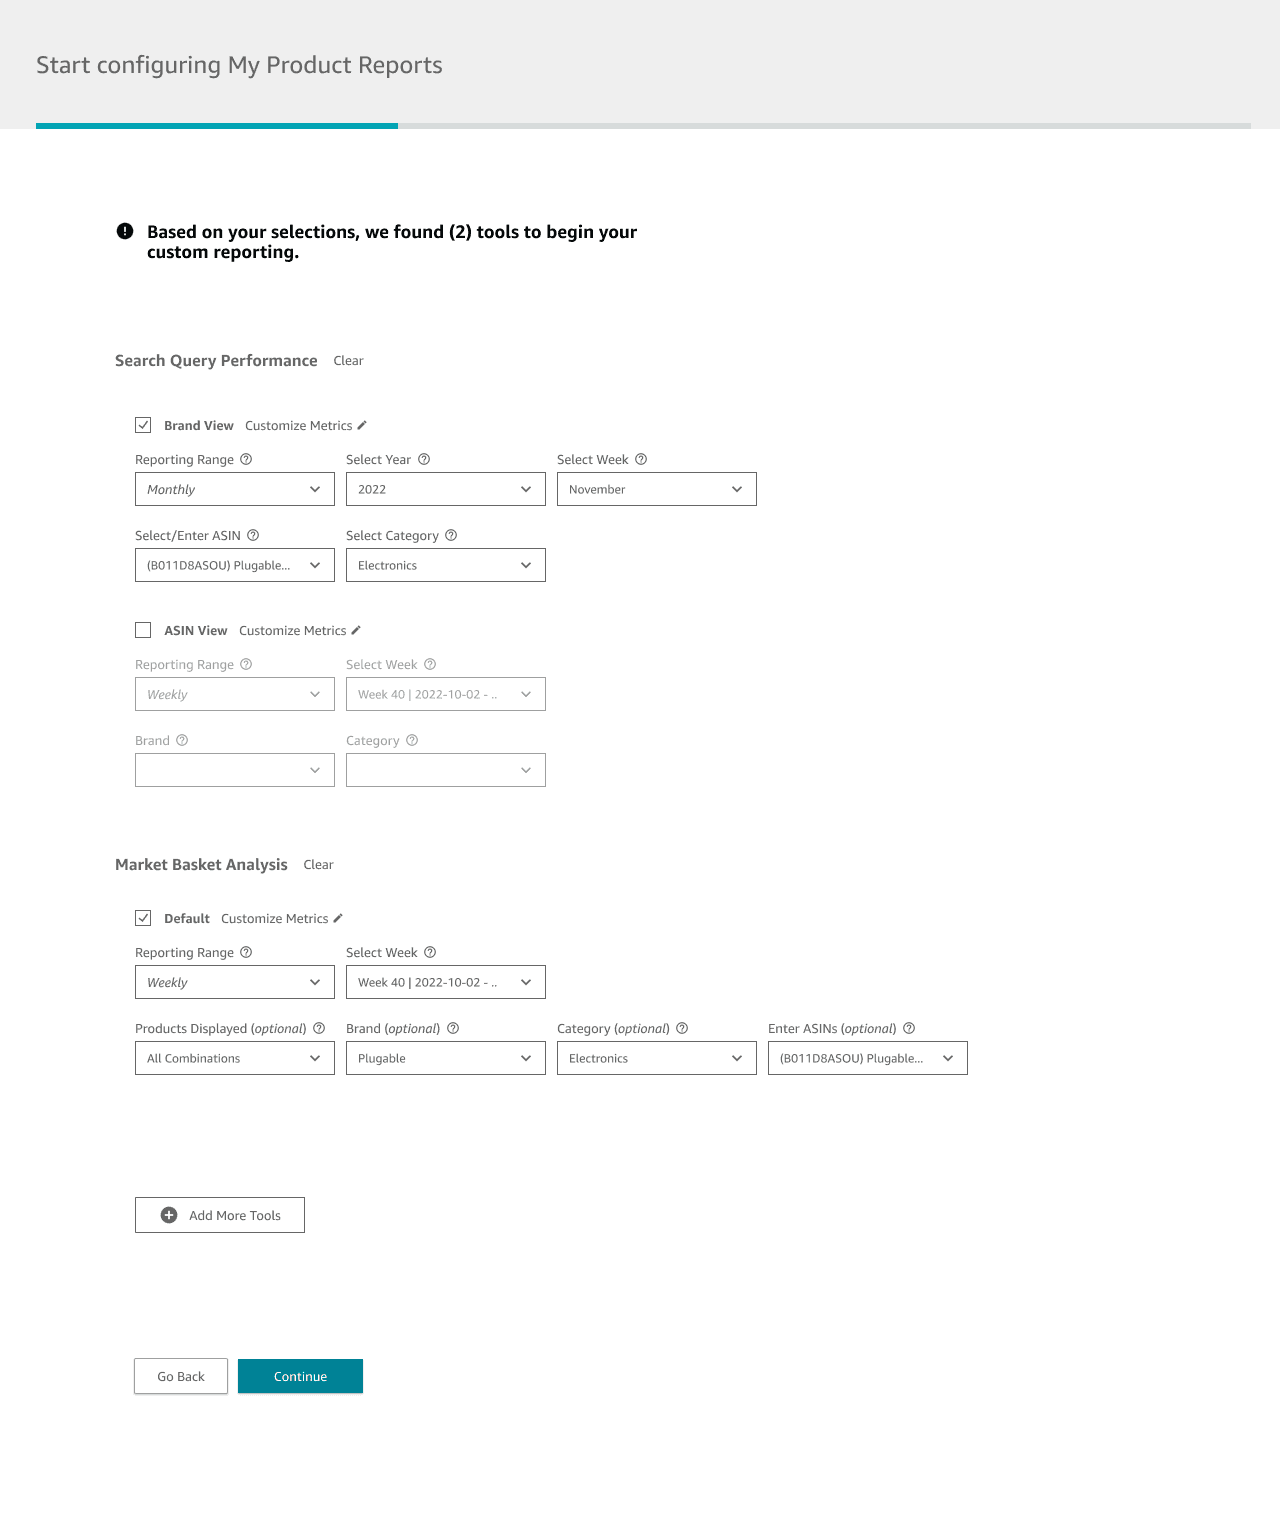
Customization Experience
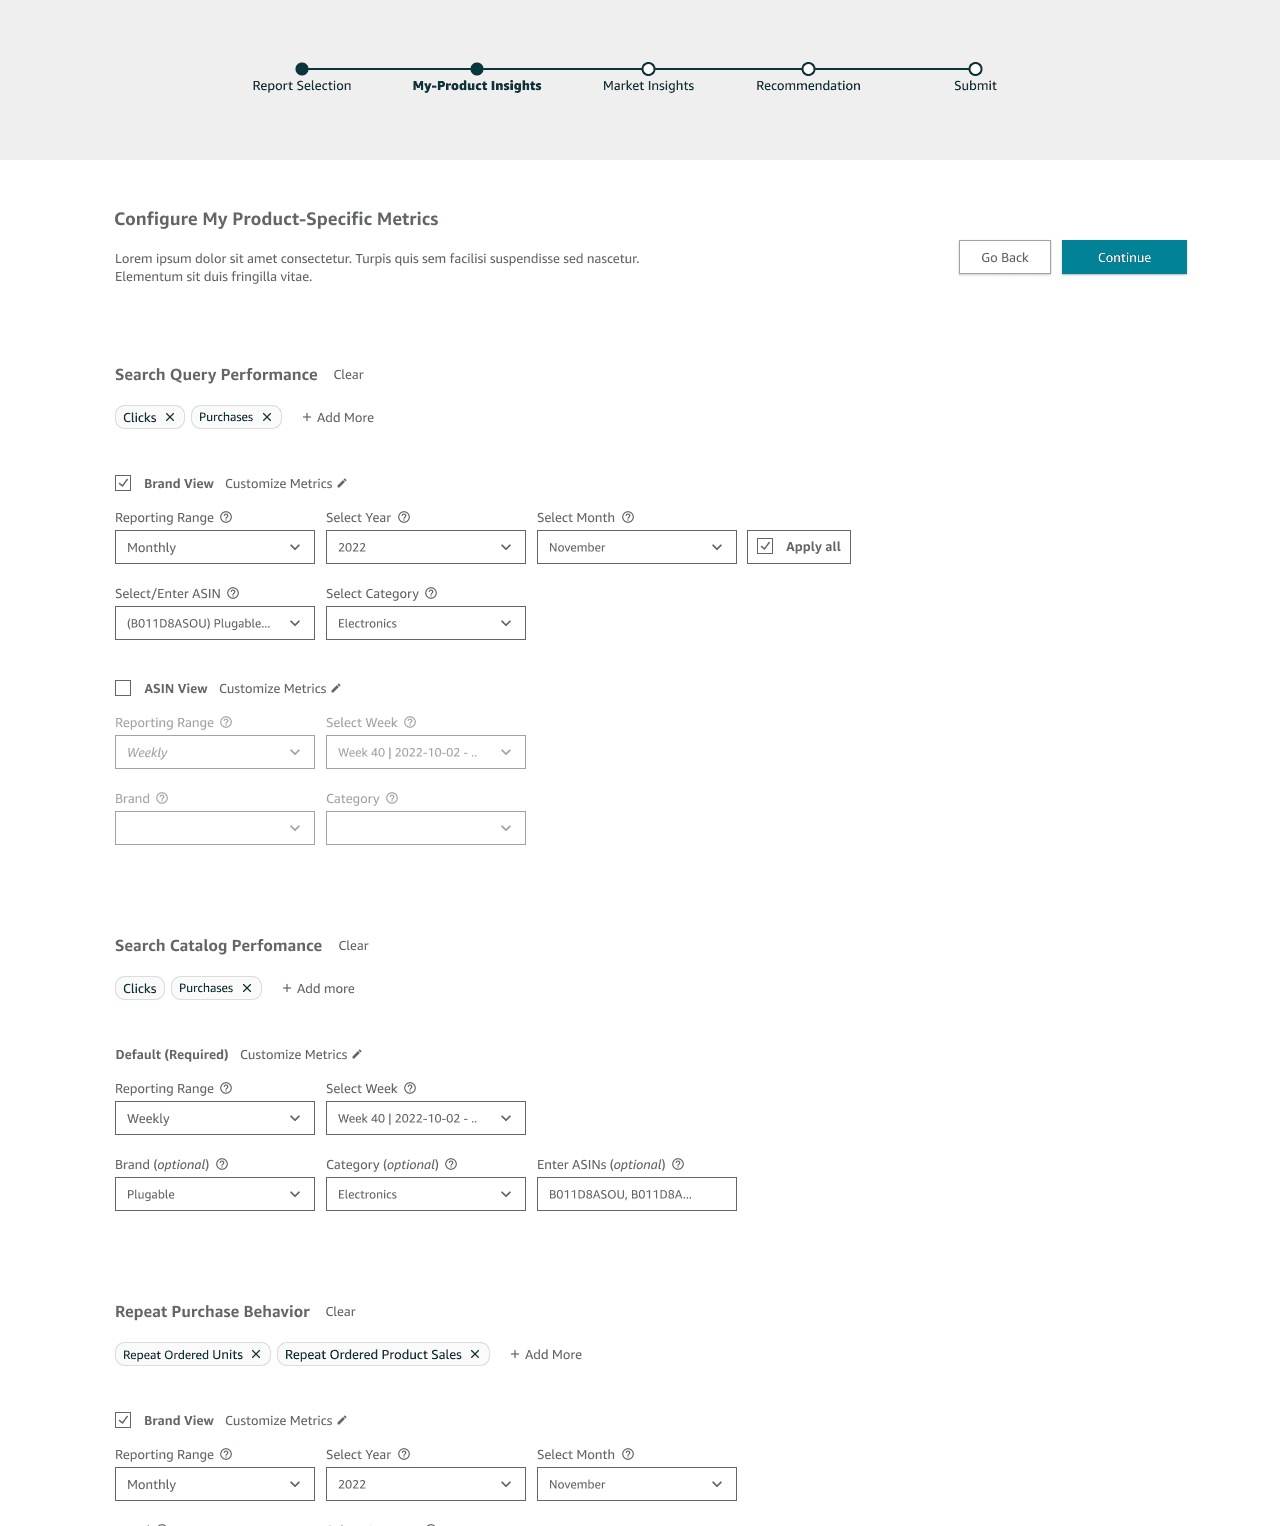
After selecting reports, sellers choose the data type — Brand-Specific or Market-Specific — plus date ranges, filters, and thresholds.
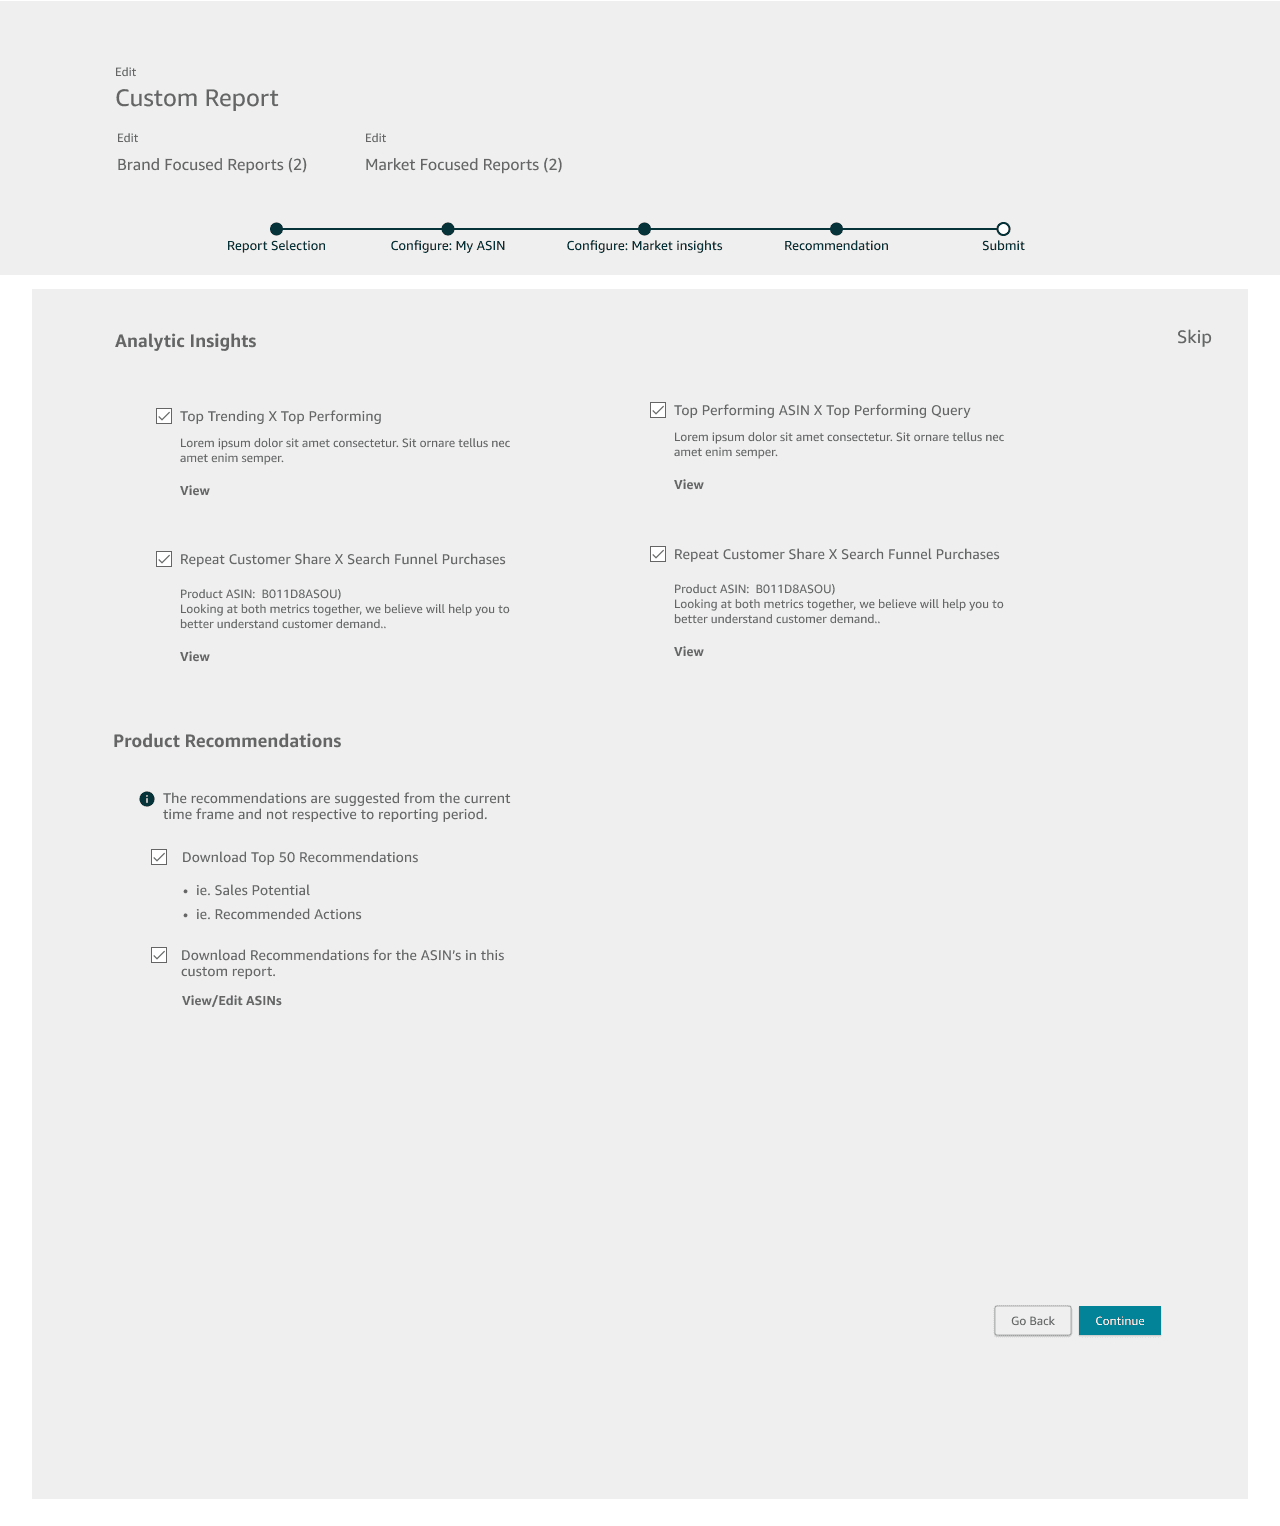
03
Suggested Reports
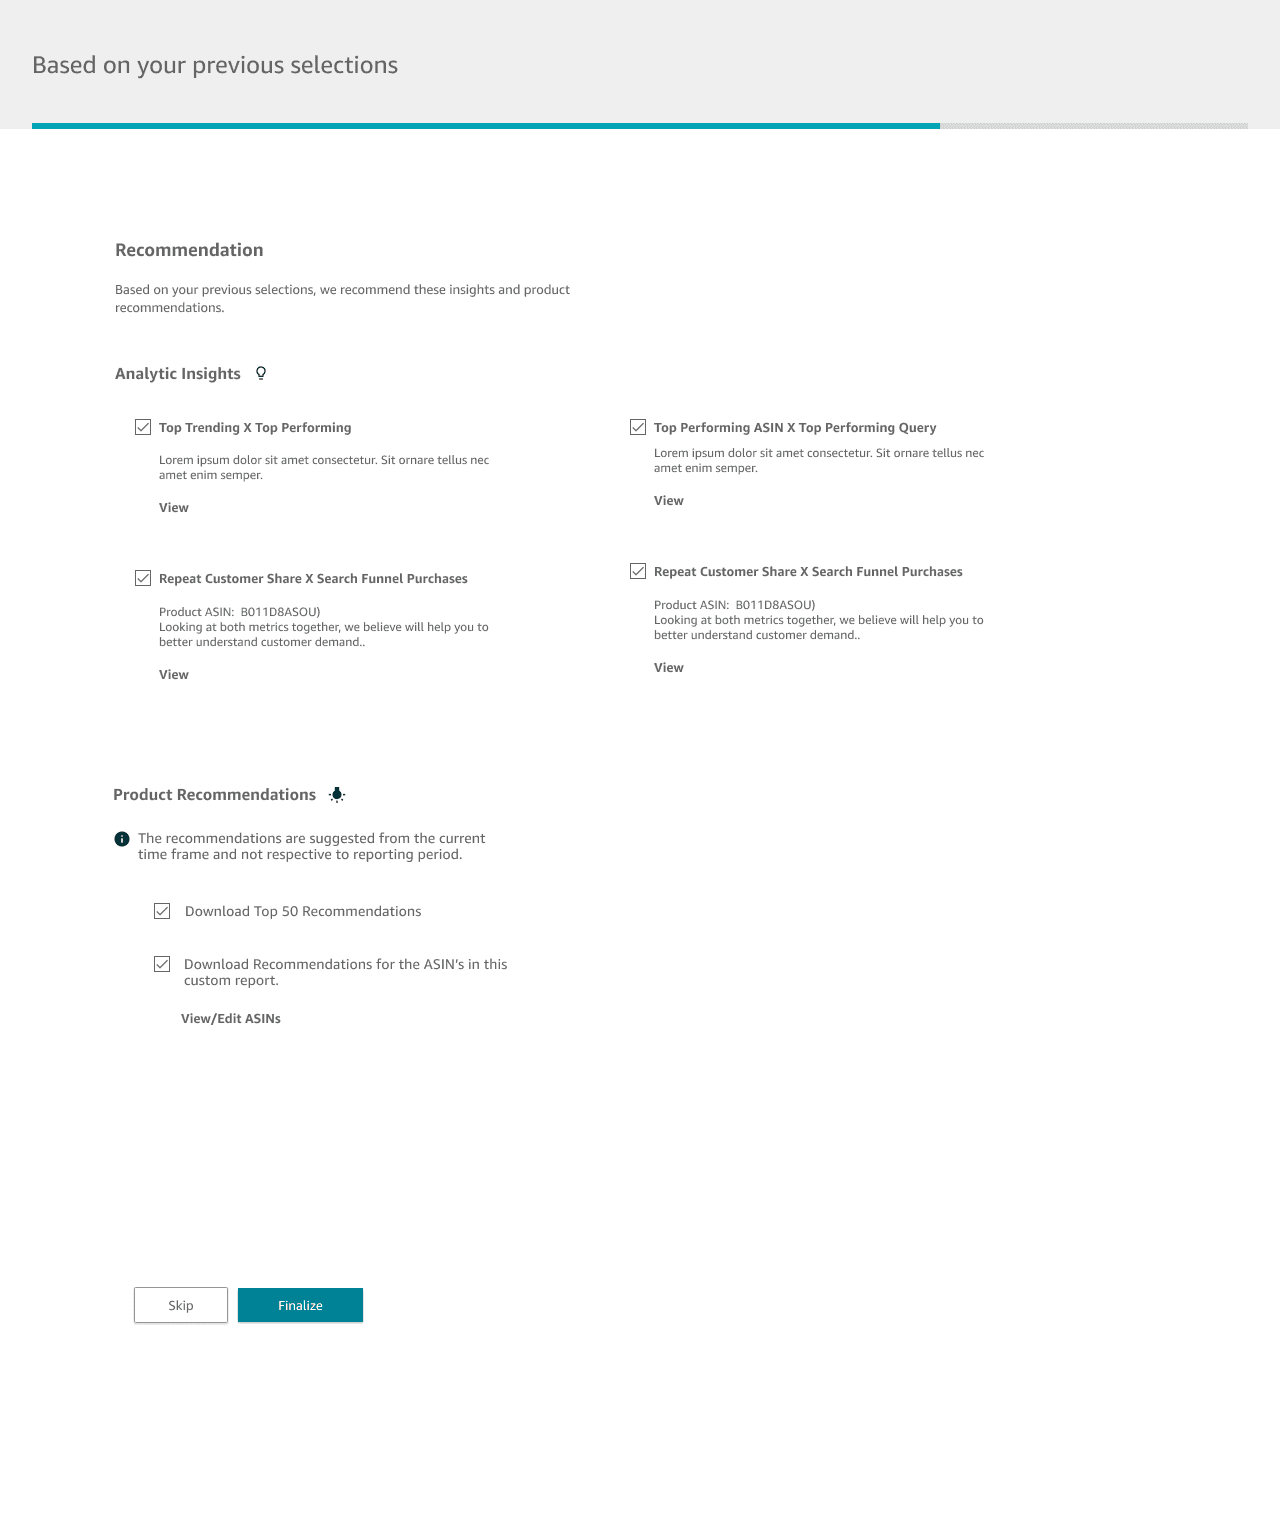
Lastly, we nudge sellers toward suggested reports based on what they've configured or selected previously.
Configuration / Modal + Filter Pills
Designing the filters and customization modal to increase accuracy and flexibility around data.
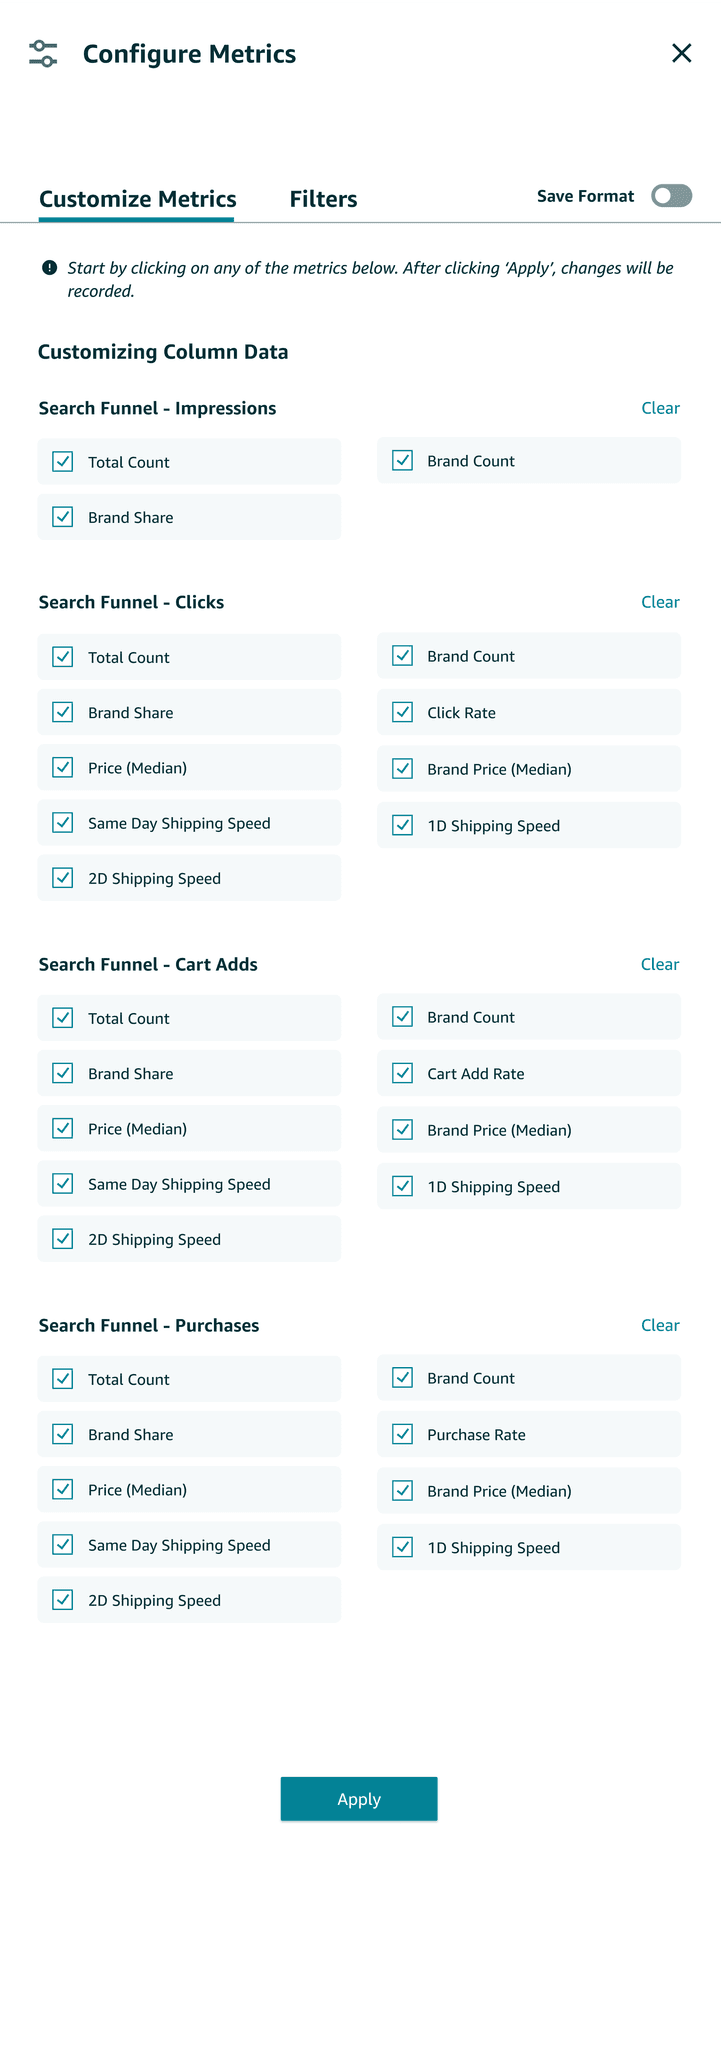
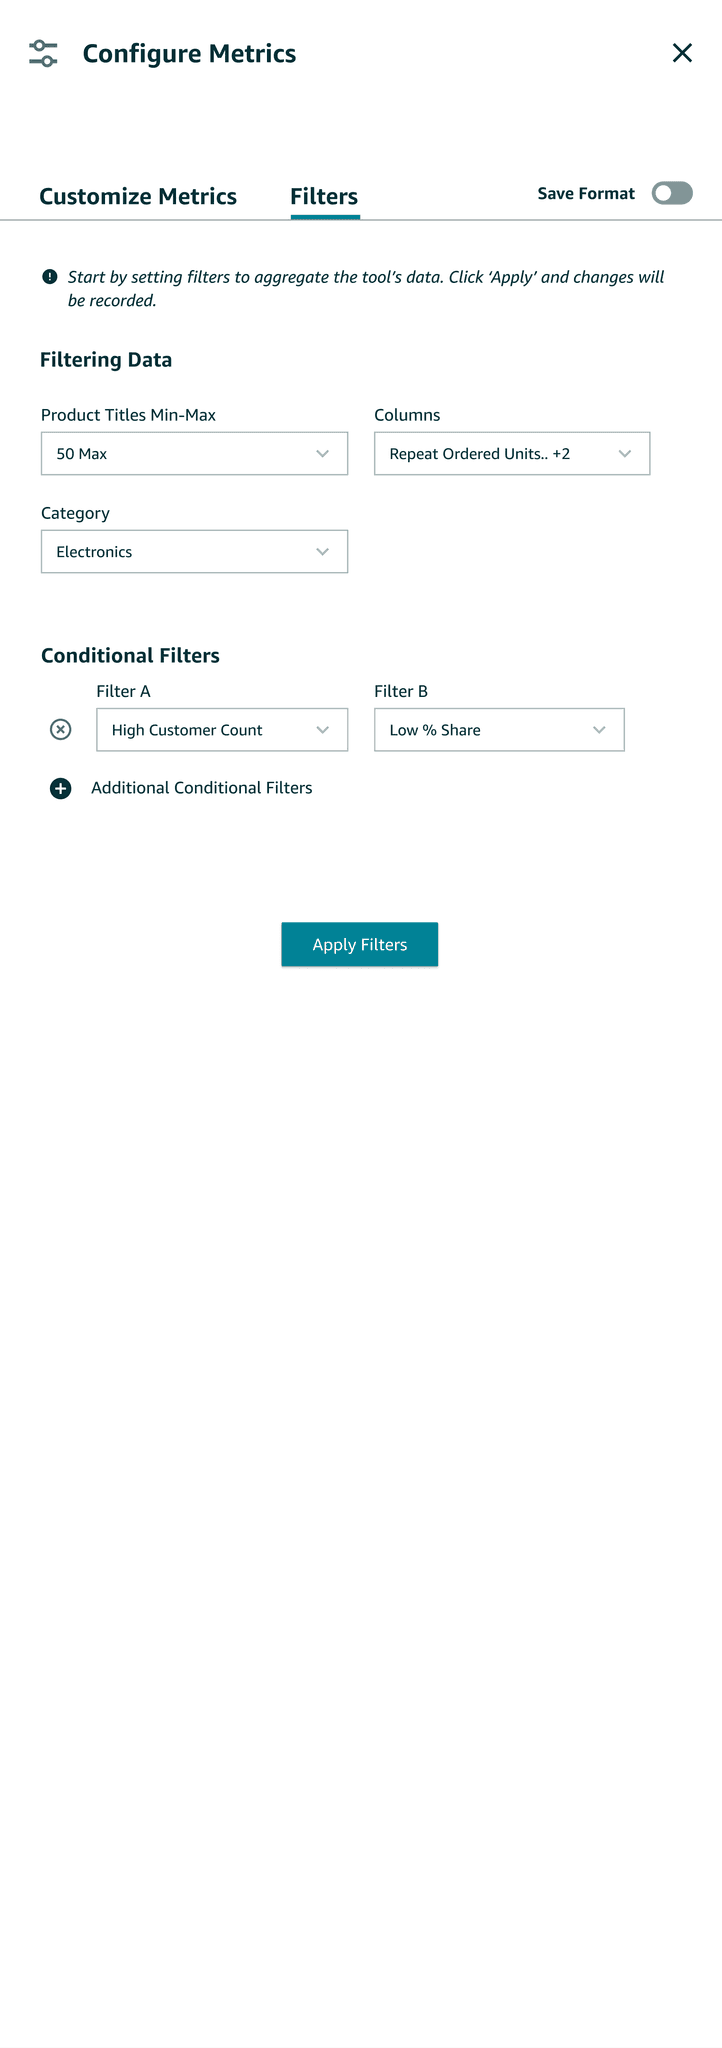
After creating low-fidelity frames, I designed two key configuration points for sellers: a modal to customize reports before download, and filter pills to quickly add or remove metric categories.
Usability Test
A/B testing two flows with 11 participants.
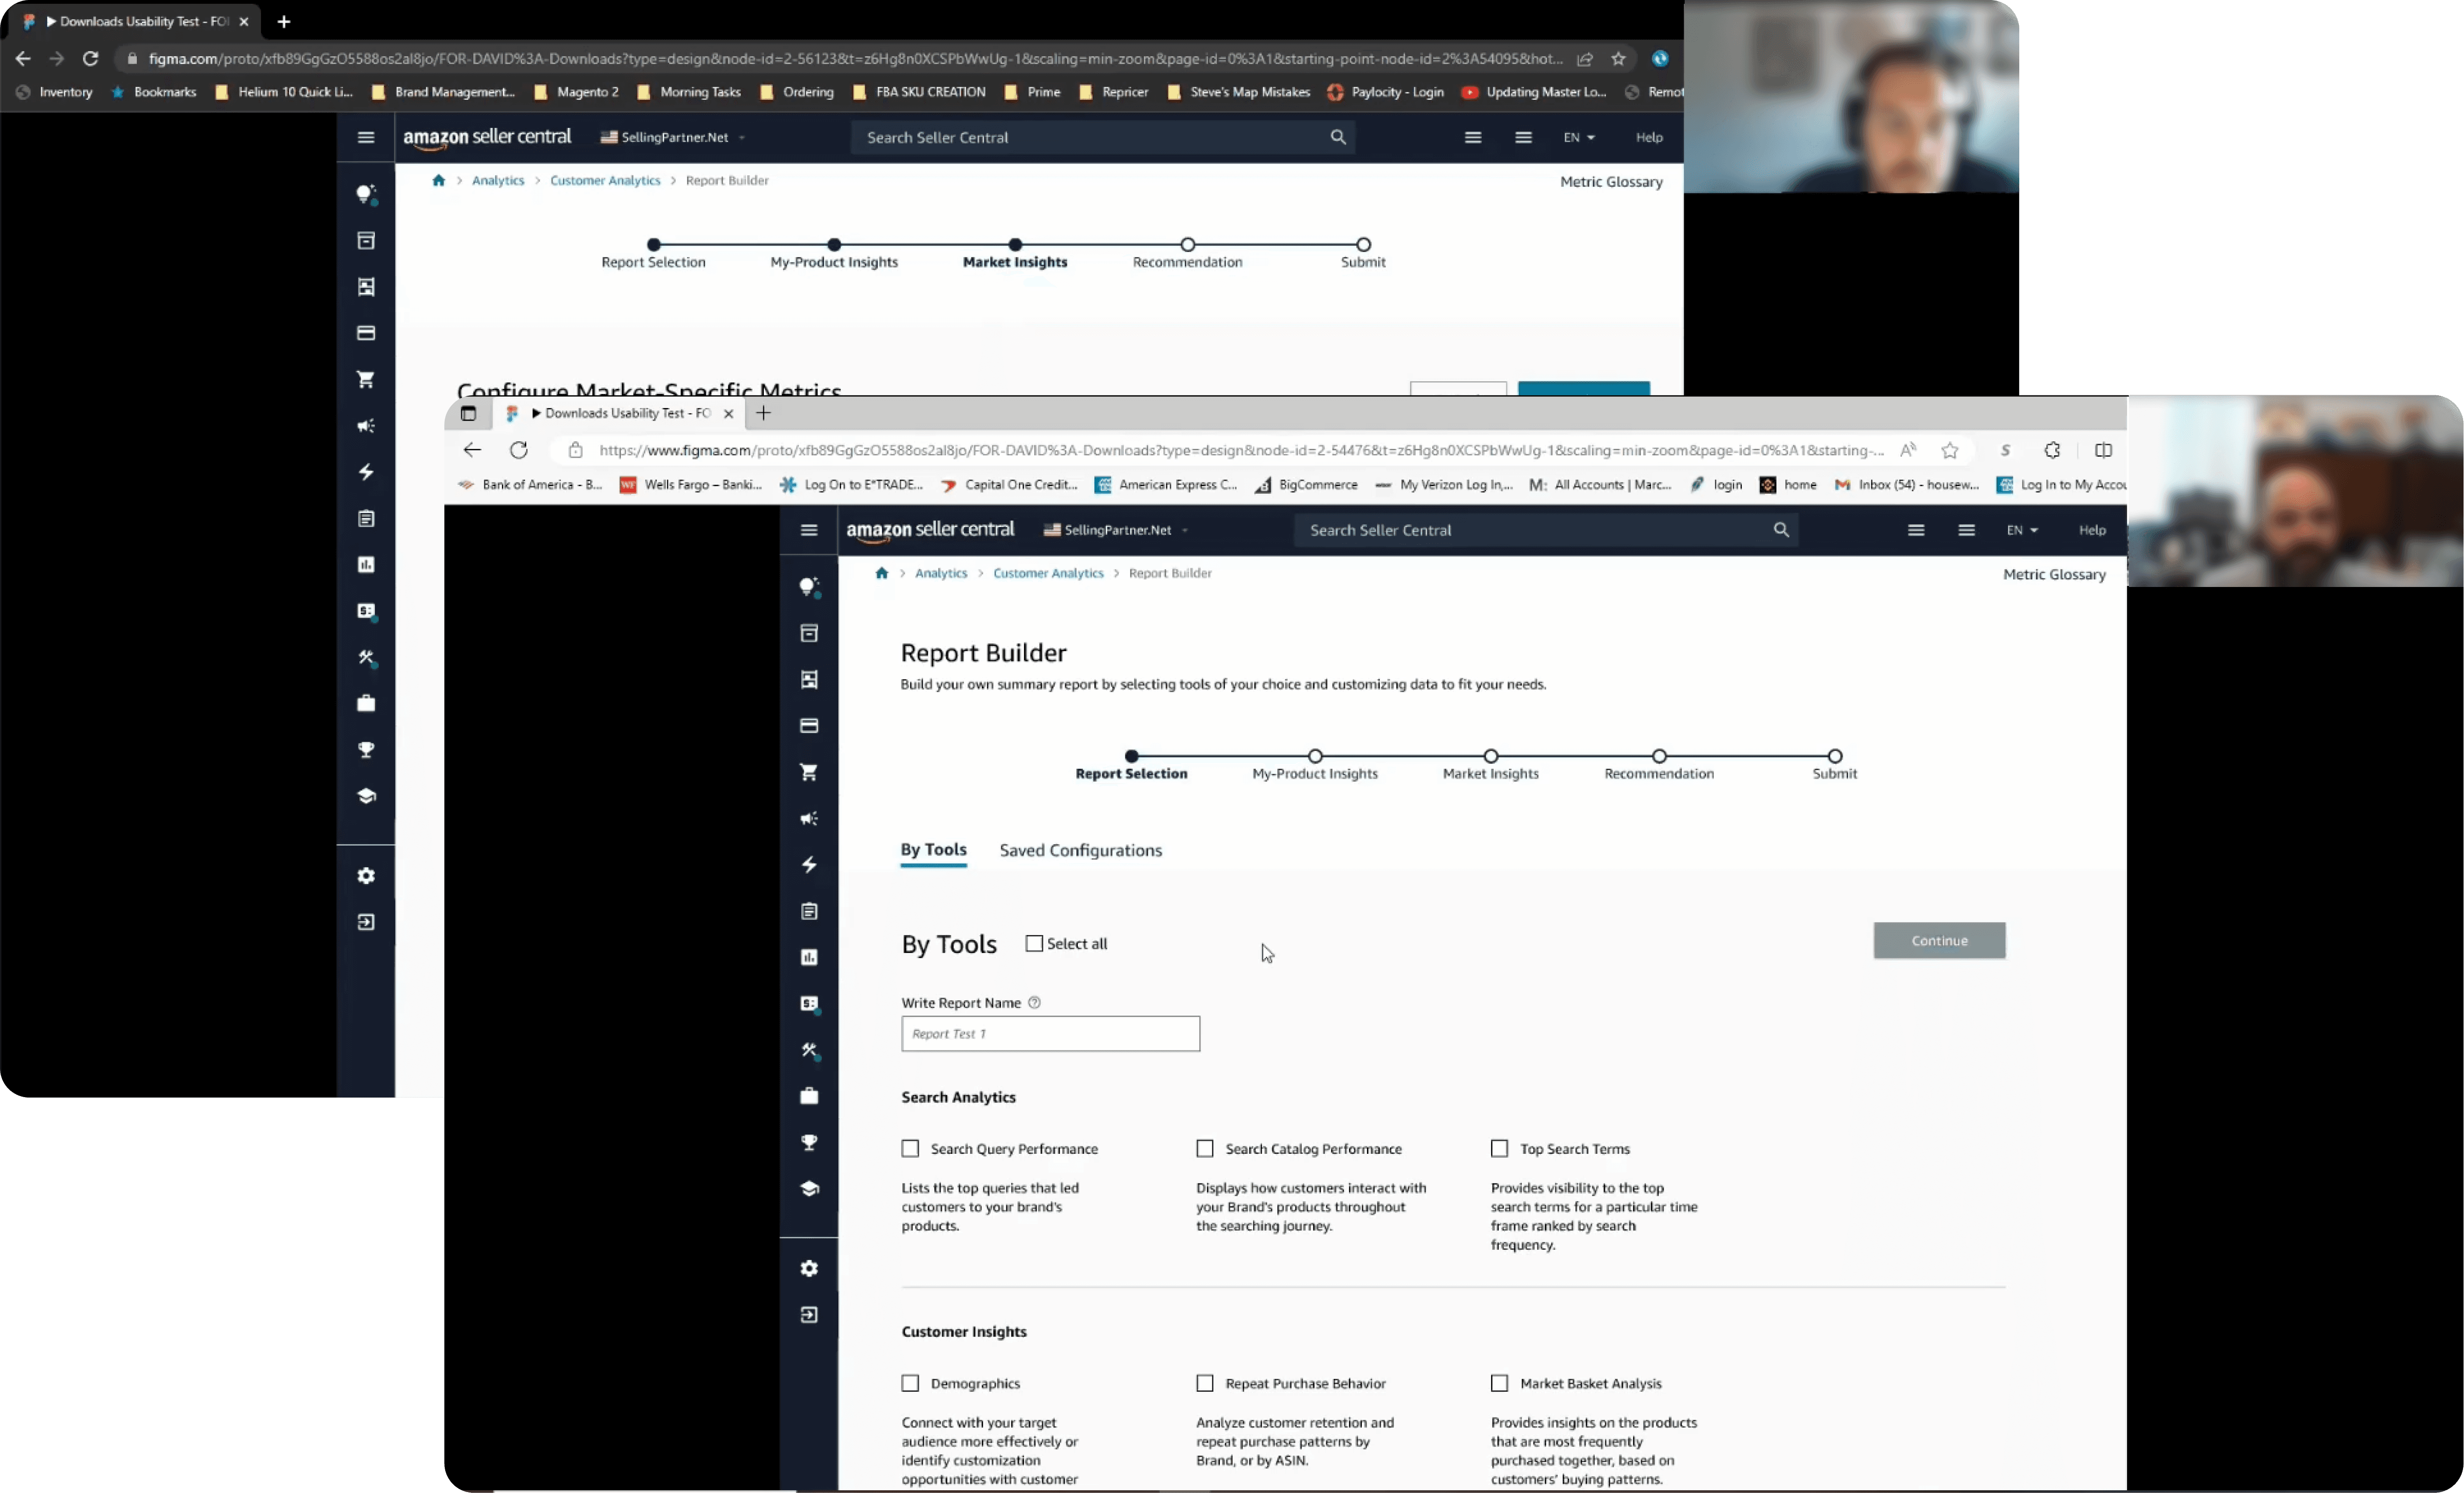
I partnered with a researcher to prototype and test two flows with 11 participants ages 18–65. The strongest insights came from the customization flow, where sellers struggled most to build downloadable reports.
Flow A / Customization
Reports separated by category type, distinguishing both brand and ASIN level data.
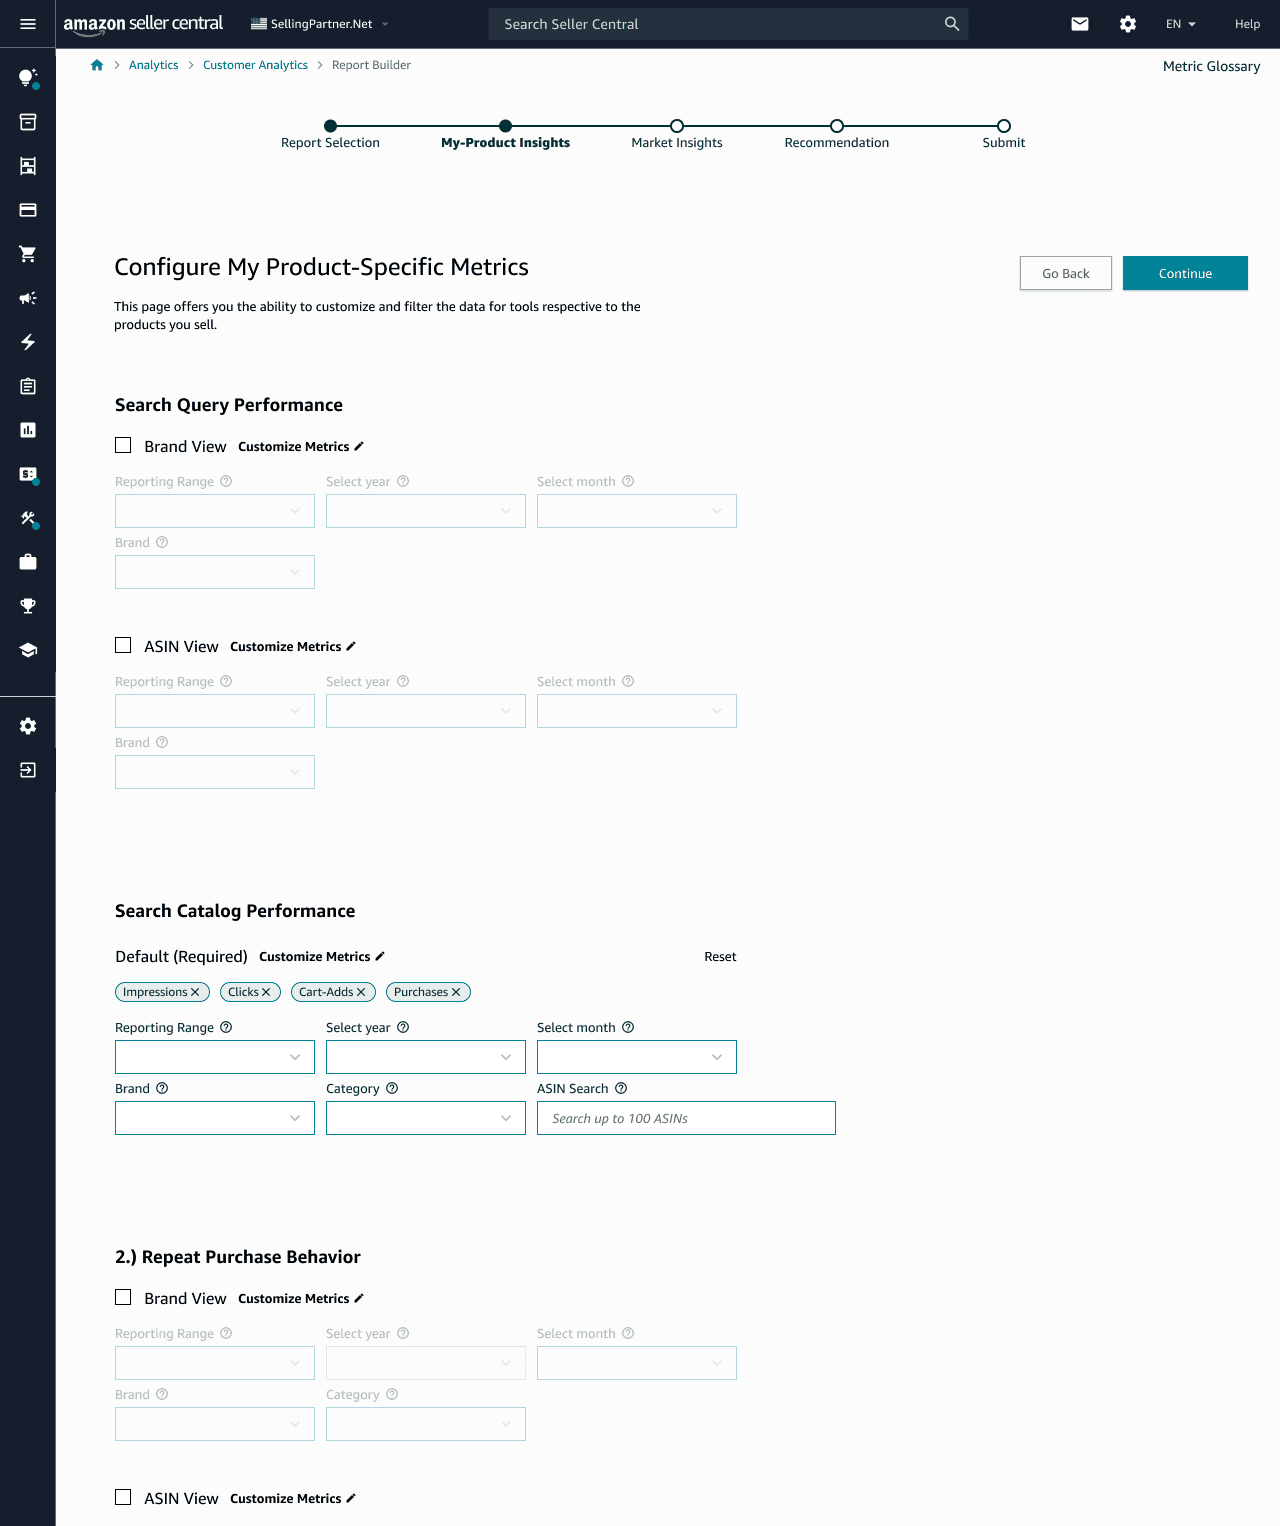
+ Reports separated by category type
+ Distinguishes both brand and ASIN level data
− Visually dense, cognitive overload
− Users may find certain reports irrelevant to their business needs
− Filter pills can remove large portions of data easily — a risk for sellers
Flow B / Customization
Configuring one report at a time to reduce visual clutter.
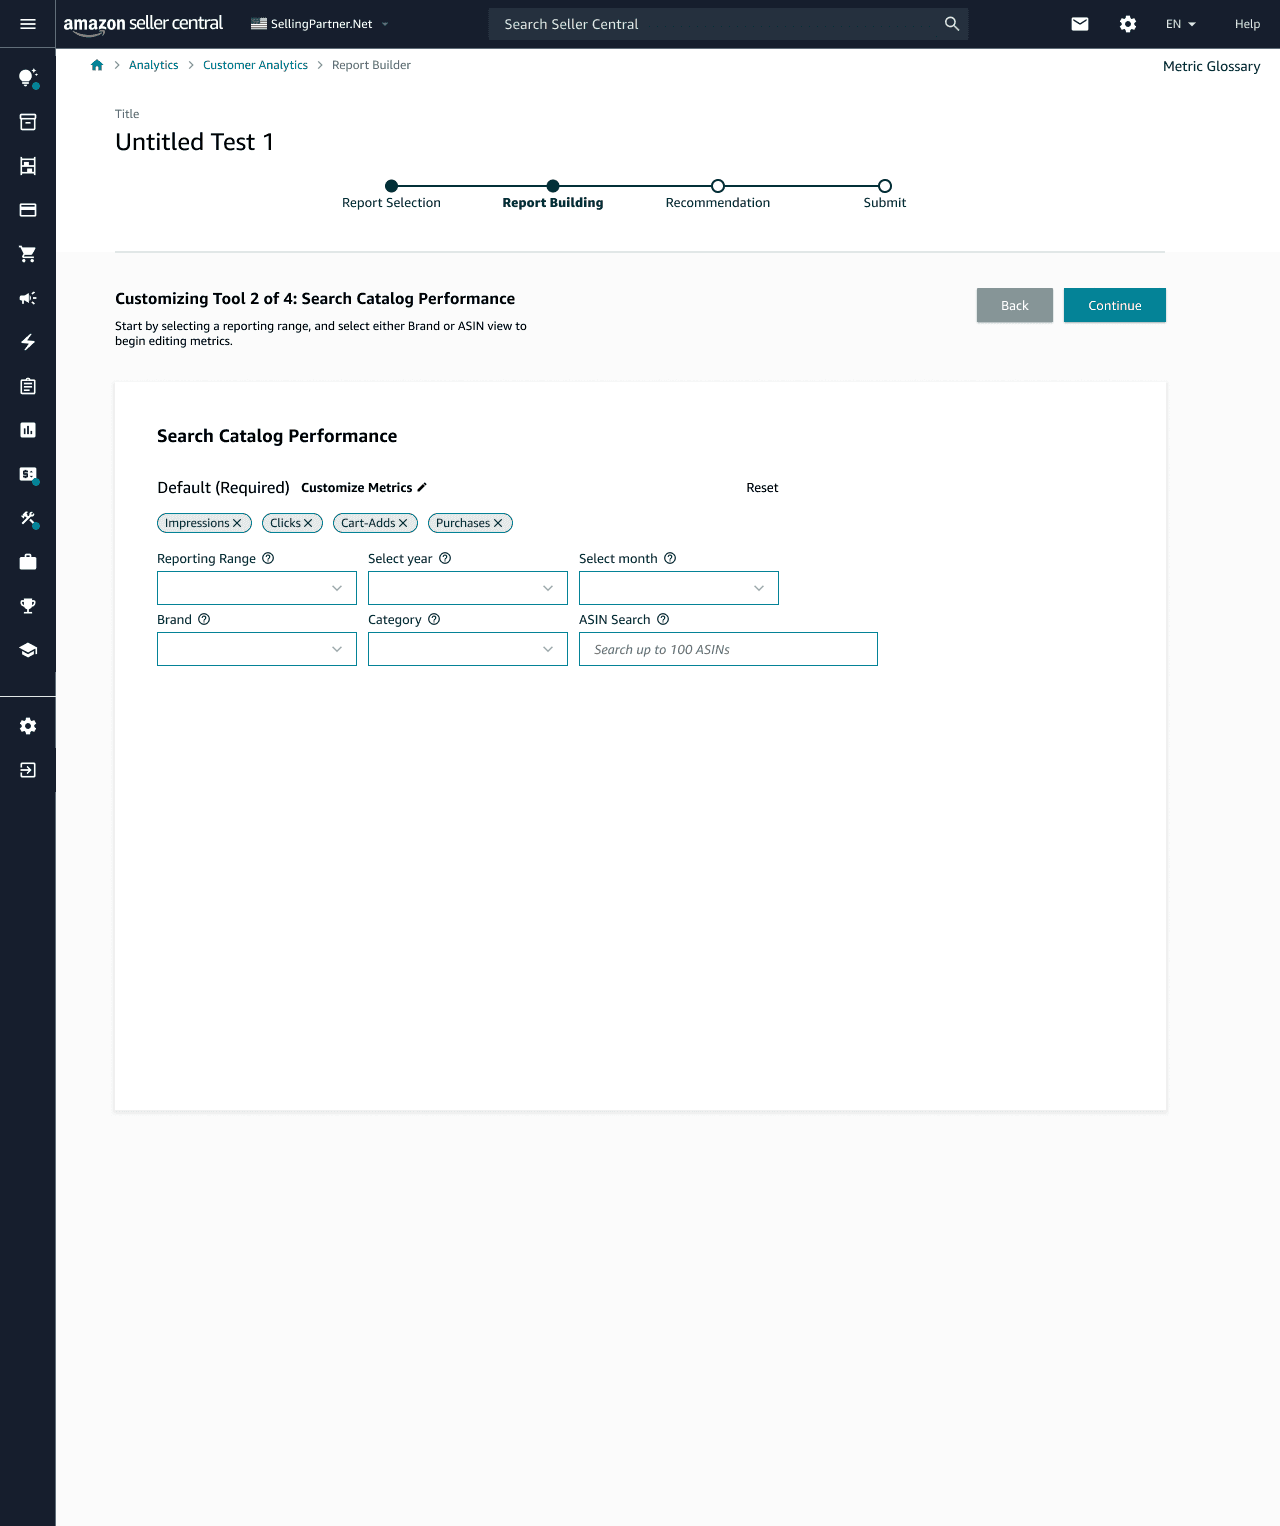
+ Configuring one report at a time reduces clutter
− Not intuitive for users to click ‘customize metrics’ and expect a modal
− Large negative space creates visual imbalance
− Pills feel redundant to what the customization modal already achieves
Customization Modal / A + B
+ Allow users to remove irrelevant categories and individual metrics more granularly.
+ Filters help set thresholds for sellers quickly.
− Confusion about whether the setting applies to all future reports and how to remove it once applied.
Results Summary
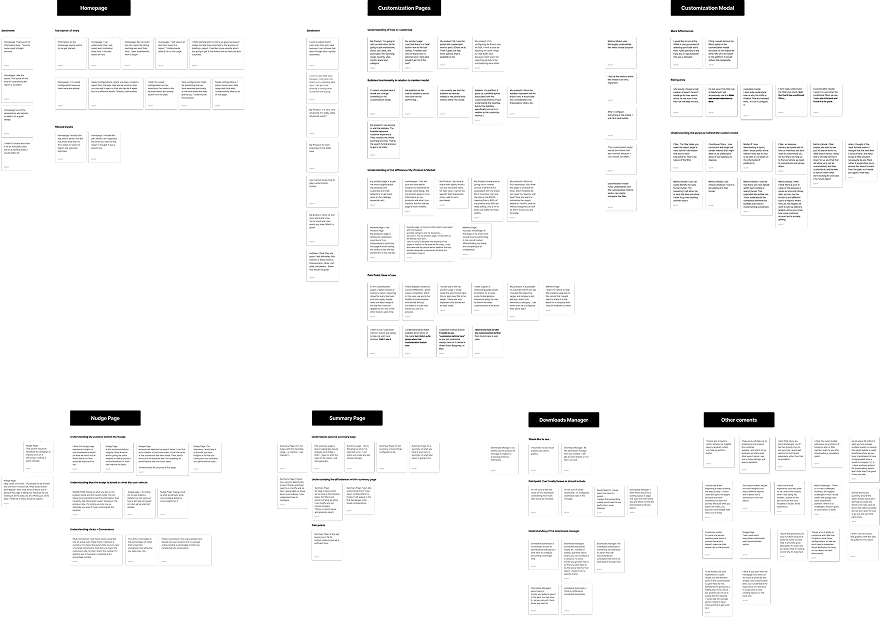
Clustering feedback to find the next best steps.
While we enabled users to configure reports in one space, the experience felt time-consuming and overwhelming. I later realized this captured a segmented portion of our user groups — those far more specialized in their understanding of the data they see.
Positive Outcomes
+ 80% agreed it would replace external tools for reporting needs
+ 70% agreed the step-by-step process felt intuitive
+ High relevance for weekly–monthly tasks
Negative Outcomes
− 70% felt customizing multiple reports at once was overwhelming
− 50% couldn't differentiate between product vs. market level data
− 50% had trouble locating the customize metrics button
Revision
Touch-ups for a simpler, frictionless configuration.
Seeing all data on one card helped users compare brand and ASIN views — but having both felt forced and made configuration unclear. I refined how users start configuration and improved access to customization options, addressing the key usability issues.
Before vs. After
Before
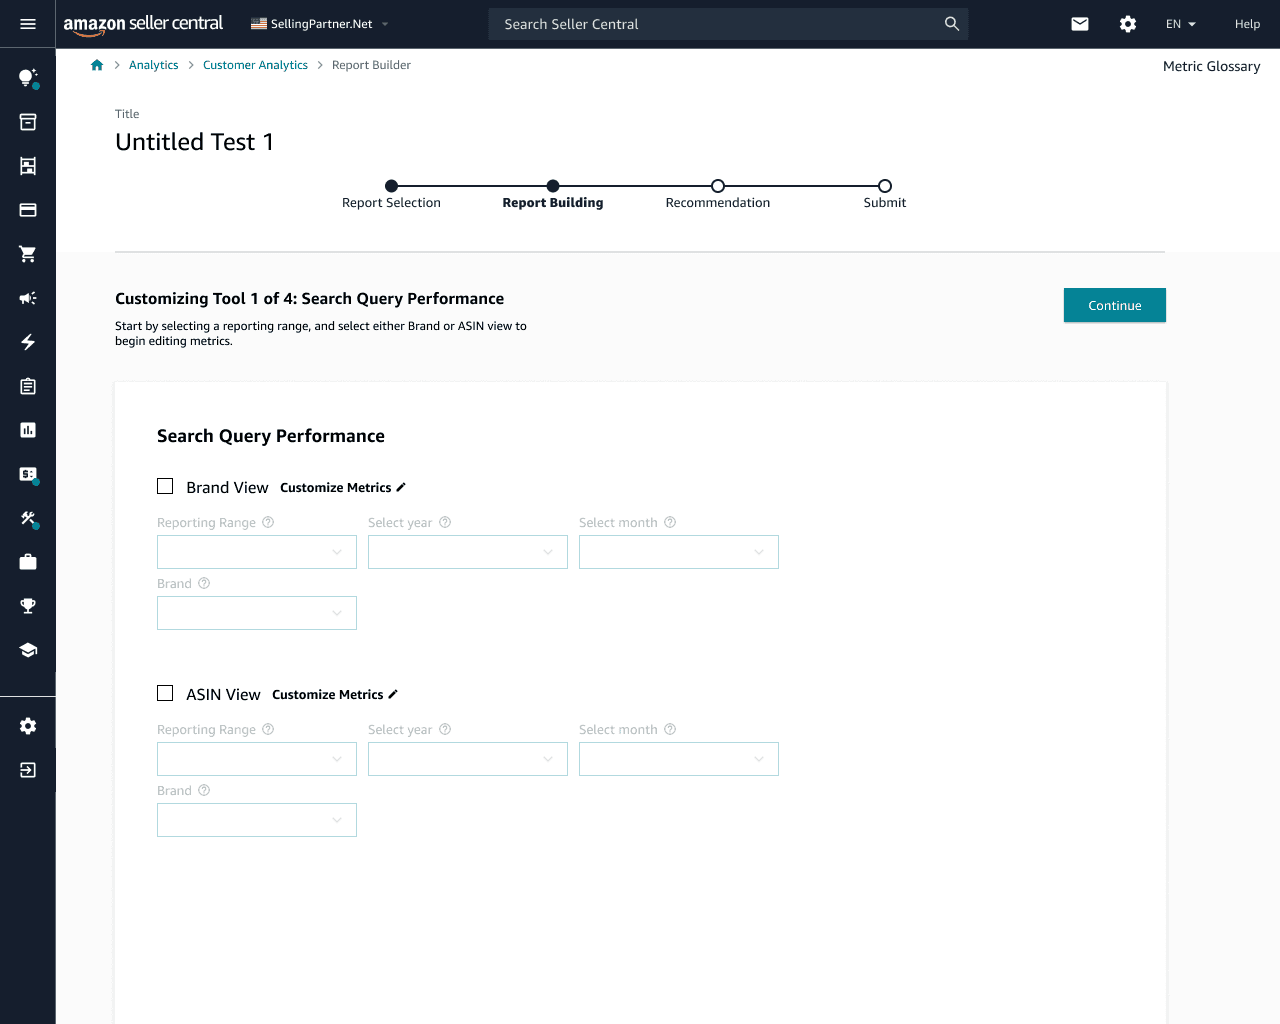
Configuration on a single card with checkboxes.
After
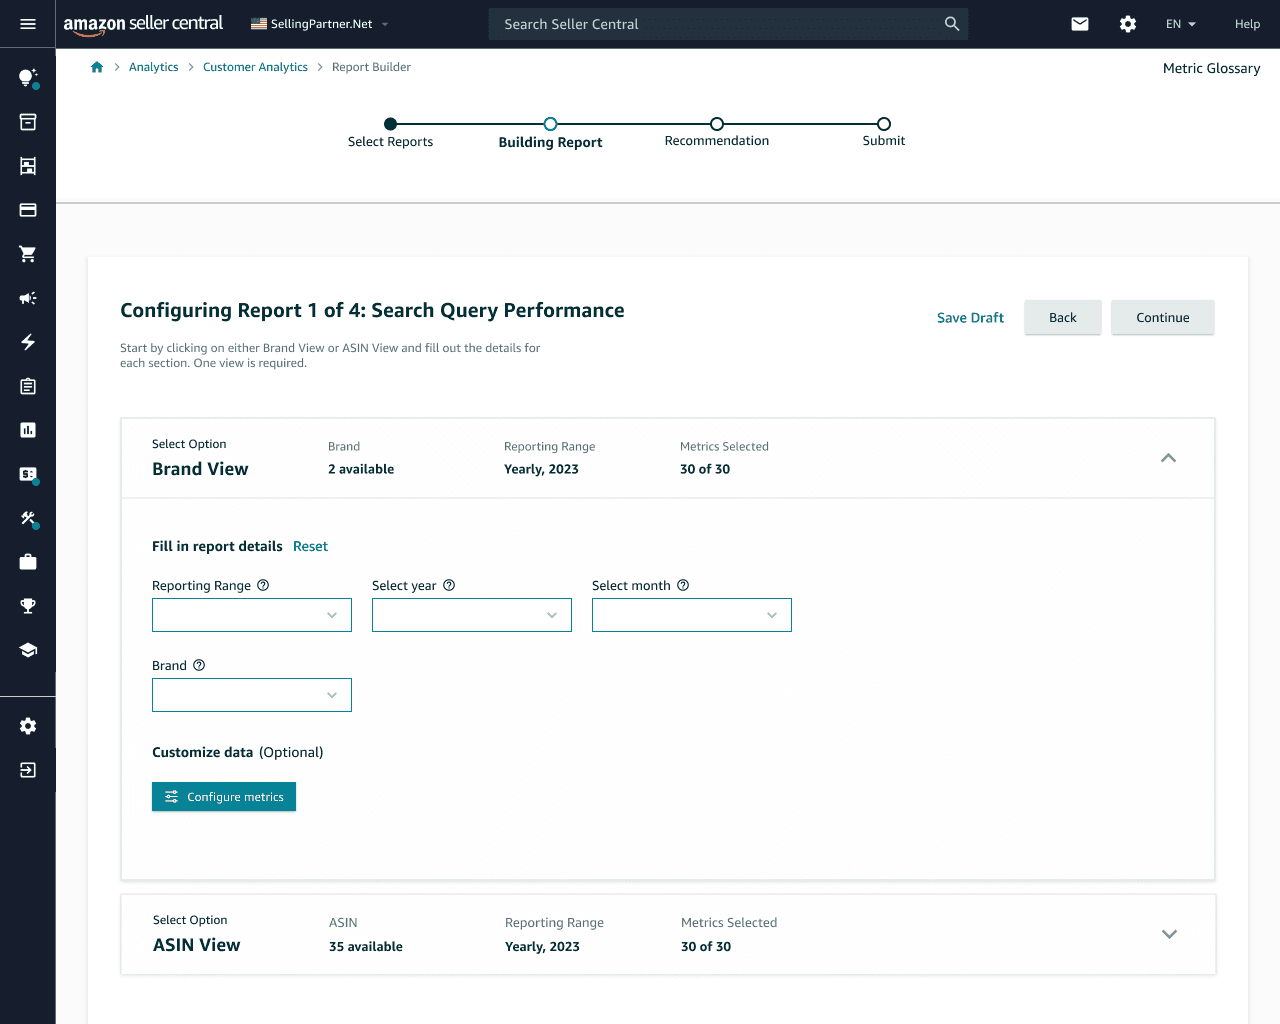
Select drop-downs with a pronounced configure CTA.
Final Handoff
Approved by two cross-functional teams.
At the close of my internship, I presented the work to two cross-functional teams — SRPS and SG&D — and secured approval to move the project forward into development.
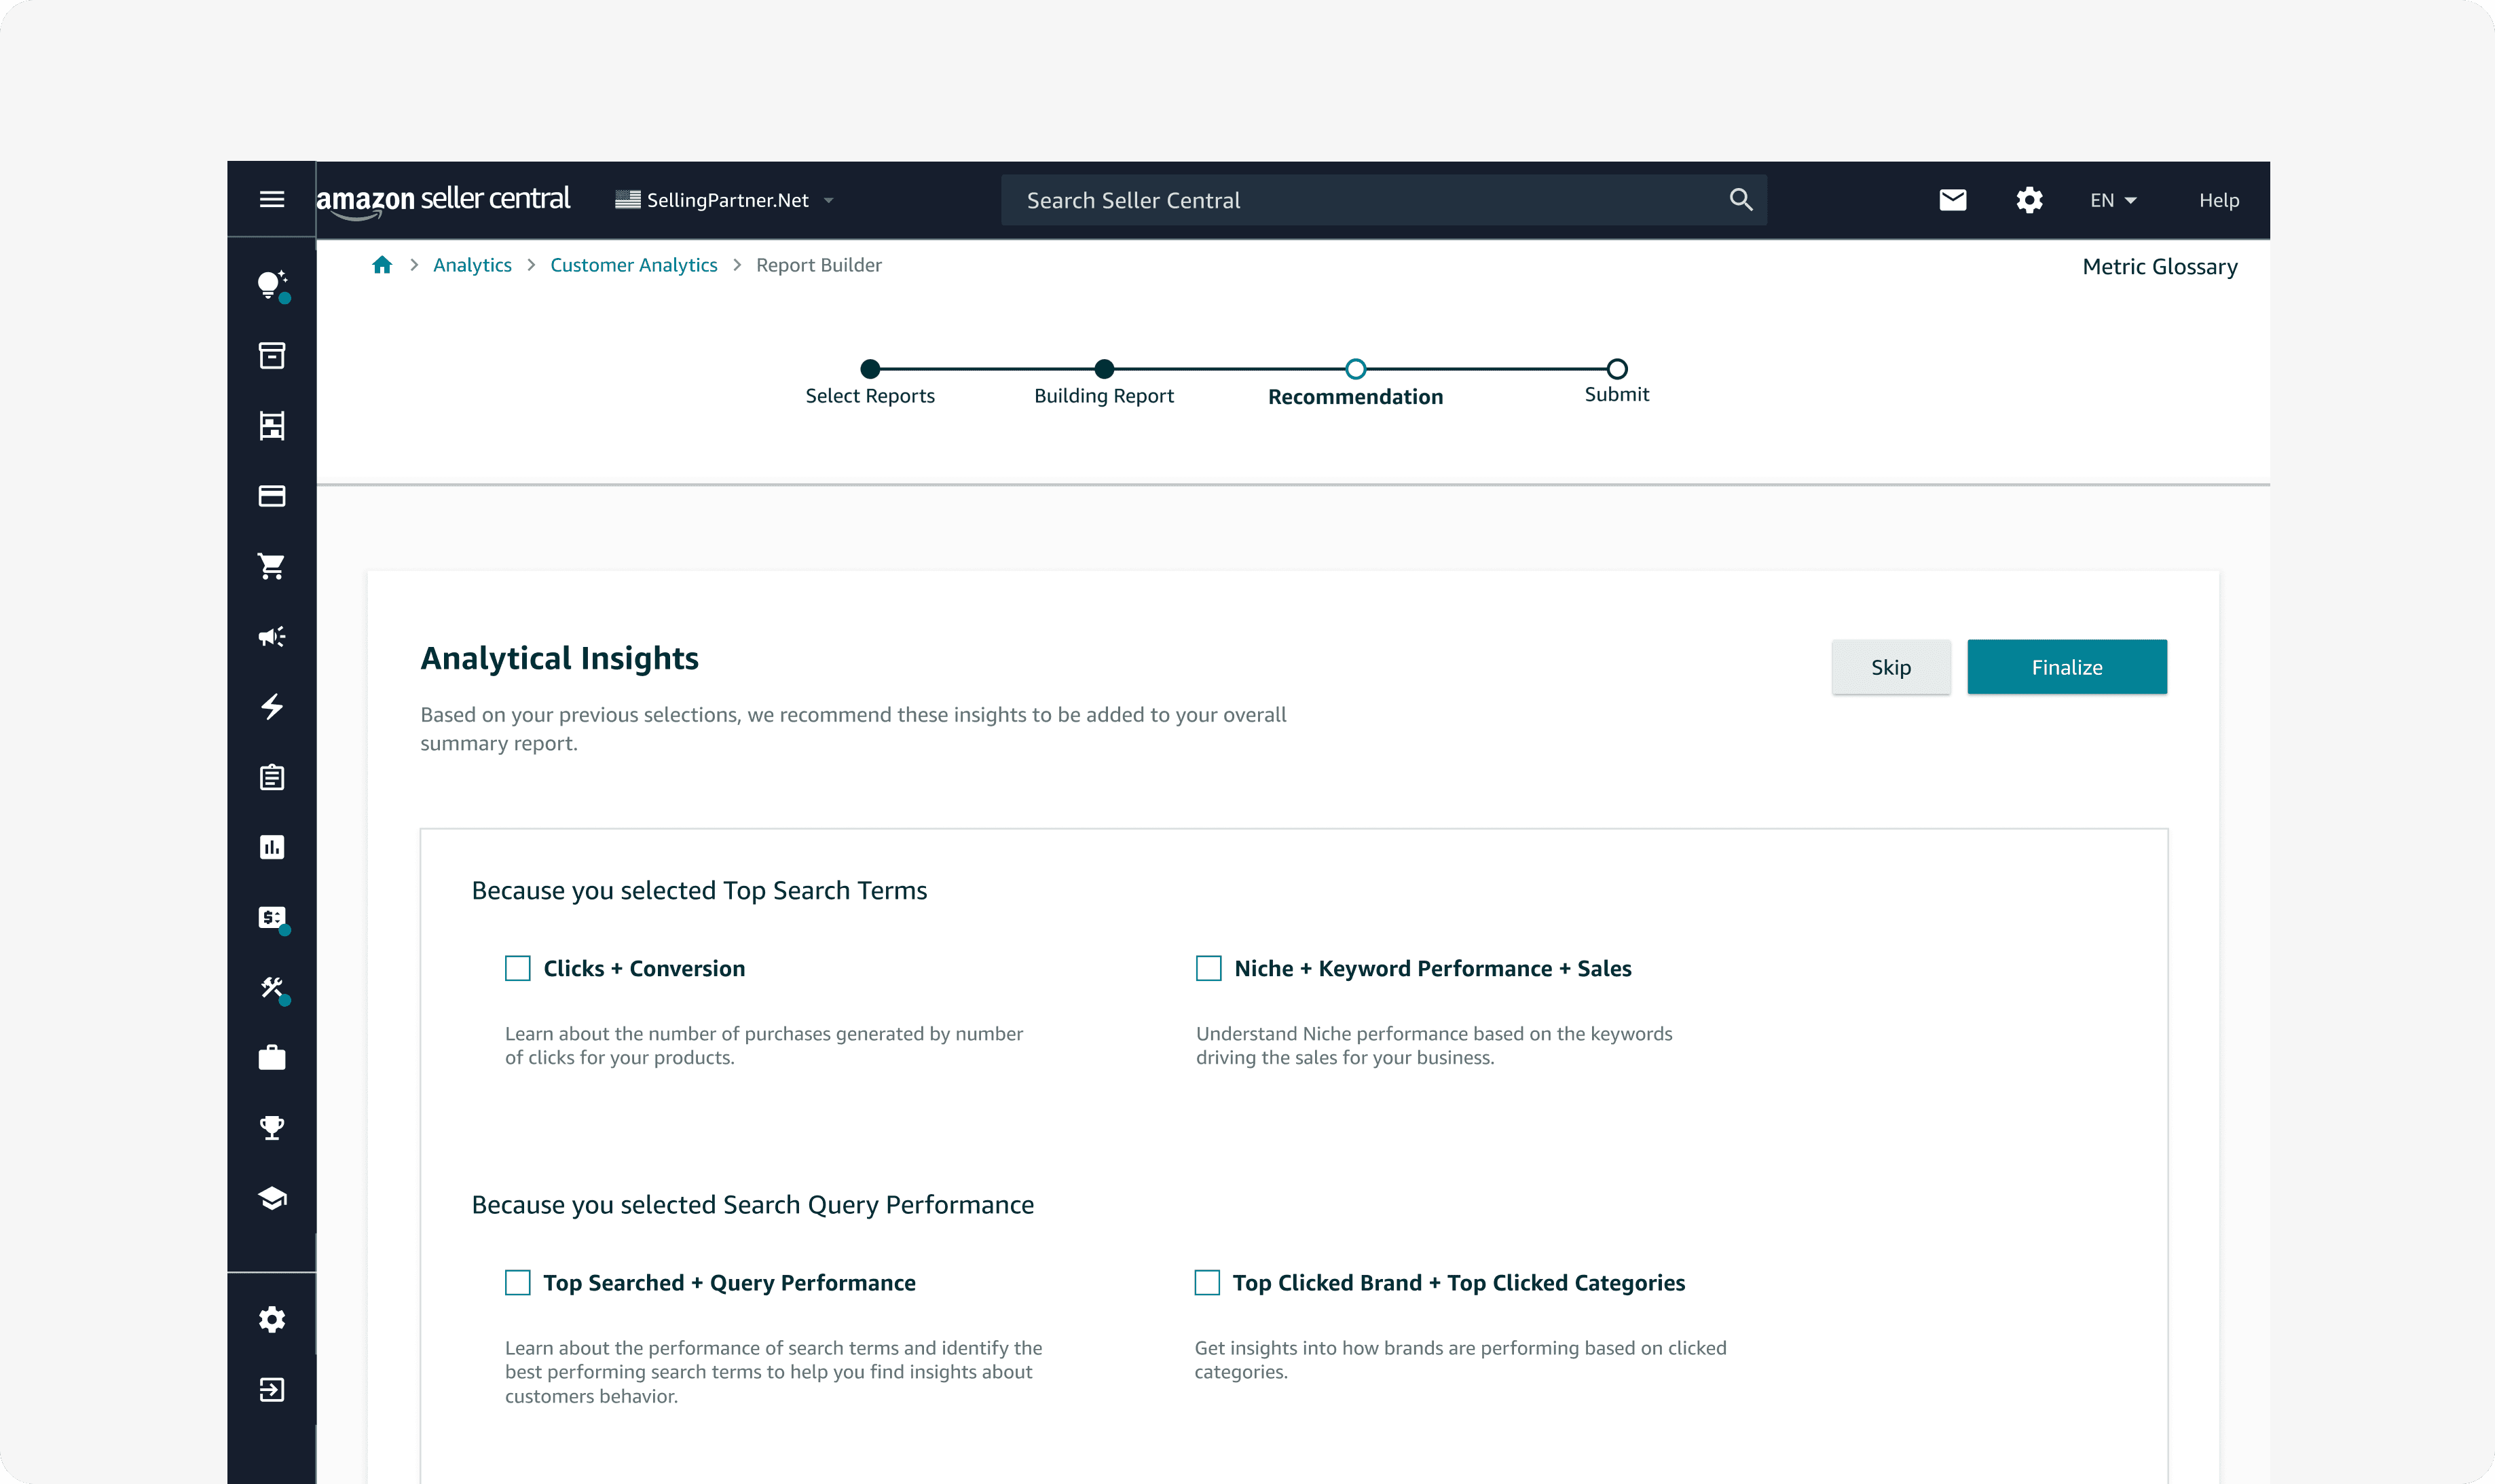
Realizing Summarized Report
Envision the finalized report sellers receive when combining multiple individual reports — partnering with engineers will be key.
Future Development
As latency issues are resolved, explore new flows for how sellers can customize reports.
Suggestions to Sellers
The nudge page already guides sellers — the summary report should better visualize these suggestions.
Reflections
Navigating constraints by focusing on the end goal.
I learned to navigate unresolved technical constraints by focusing on the end goal and communicating progress openly with my team. That transparency created continuous feedback loops — helping me step back from details, refocus on the bigger picture, and deliver solutions that moved the project forward despite challenges.